GALLUP NEWS SERVICE
PRINCETON, NJ -- As Americans prepare to celebrate Christmas, a new CNN/USA Today/Gallup poll finds most are apparently looking forward to it. Half say it is a "great time" or the "best time of the year." Slightly less than half of Americans say it is a "strongly religious" holiday for them. Most people say they usually feel some stress in getting ready for the holiday, but only about one in three say they feel a great deal or fair amount of stress.
The poll also shows Americans have shifted toward putting "Christmas" back in the holiday season, both in the way they greet others at this time of year and in the way they feel stores and other public institutions should acknowledge the season.
Celebrating Christmas
The Dec. 16-18 poll finds that 96% of all U.S. adults celebrate Christmas, a percentage that has been consistent over the past decade. This includes a high level of participation -- 84% -- among non-Christians.
Most Americans feel positively toward Christmas. Half say it is a great time, including 15% who say it is the best time of the year for them. An additional 35% say it is a good time. Eight percent say it is neither good nor bad, and 3% say it is a bad time.
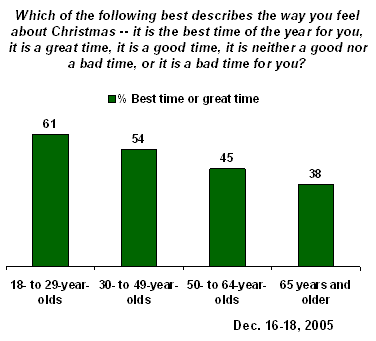
Younger adults are significantly more likely than older adults to describe Christmas in positive terms. Sixty-one percent of 18- to 29-year-olds say it is the best time of year or a great time. That percentage is 54% among those aged 30 to 49, 45% among those aged 50 to 64, and just 38% of those 65 and older.
Also, parents of young children are more likely to express more positive attitudes toward the holiday -- 62% of parents of children under 18 say it is the best time or a great time of the year, compared with 43% of those who do not have young children.
Many Americans celebrate the holiday in ways that go beyond exchanging gifts and holiday greetings. The poll asked Americans how much time and effort they spend on Christmas-related activities -- such as decorating the house, having parties, or baking cookies -- compared with other people they know. Twelve percent believe they spend a lot more time and effort on these activities than most people they know, 30% say they spend a little more time and effort. Thirty-two percent say they spend a little less time, and 22% say a lot less time.
There are differences in the effort and time people put into Christmas activities by marital status. Fifty percent of those who are married believe they spend more time on Christmas activities than people they know. Only 31% of unmarried people say this.
There is a similar difference between those with young children and those without. Fifty-two percent of parents with children under 18 believe they spend more time "decking the halls" than most people, while only 37% of those who don't have young children say this.
A Dec. 9-11 CNN/USA Today/Gallup poll asked Americans specifically about sending Christmas cards. Eighty-one percent of Americans say they plan to give or send Christmas cards this year. According to the poll, the average American will send or give 31 Christmas cards this year. The average card-giver will send or give 37.
The Religious Aspect
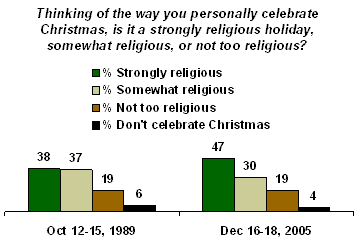
Given that Christmas is the Christian celebration of the birth of Jesus Christ, and given that the United States is a predominantly Christian nation, religion plays an important part in the holiday for many Americans. According to the Dec. 16-18 poll, 47% of Americans say Christmas is a strongly religious holiday for them, up from 38% in 1989. Thirty percent say it is somewhat religious, and 19% say it is not too religious.
Fifty-four percent of Christians say it is a strongly religious holiday, 33% say it is somewhat religious, and 11% say not too religious.
Weekly churchgoers are far more likely to say Christmas is a strongly religious holiday for them -- 80% of those who attend church weekly say so, compared with 49% of those who attend religious services nearly weekly or monthly and 24% of those who seldom or never attend.
Holiday Stress
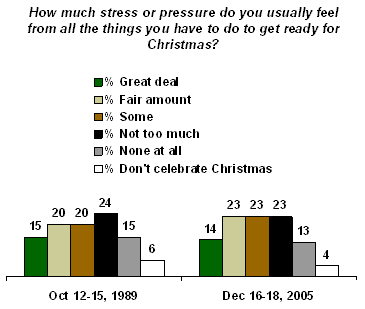
Even though Christmas is largely a happy occasion for most Americans, the days and weeks leading up to it can be stressful with the shopping in crowded stores, decorations to put up, and holiday parties to attend. Most Americans admit to feeling at least a little stress or pressure around the holidays, but only about one in three say they feel a great deal (14%) or fair amount (23%) of stress. An additional 23% say they feel some stress, while 23% do not feel much and 13% do not feel any stress.
A similar question was asked in a 1989 Gallup Poll. Apparently, Christmas has not become any more stressful. At that time, 15% felt a great deal of pressure and 20% felt a fair amount from all the things they had to do to get ready for Christmas.
Happy Holiday Backlash?
There has been a major shift in Americans' attitudes toward holiday greetings in the last year -- 69% say they would greet someone they just met with the phrase "Merry Christmas," while 29% would opt to say "Happy Holidays." Last year, Americans still preferred the "Merry Christmas" greeting, but by a smaller 56% to 41% margin.
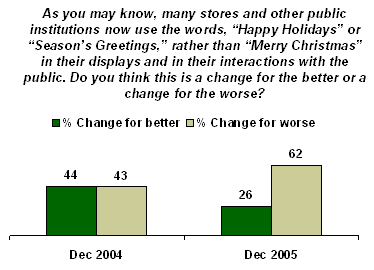
That change is also evident in Americans' attitudes about how stores and other public institutions acknowledge the holidays. An average of 62% of Americans in two polls (Dec. 5-8 and Dec. 16-18) say that public institutions' and stores' use of "Happy Holidays" or "Season's Greetings," rather than "Merry Christmas," is "a change for the worse," while just 26% say it is a "change for the better."
Last year, the public was evenly divided, with 44% saying the change was for the better and 43% for the worse.
This year, conservative talk-show hosts such as Bill O'Reilly have taken up the crusade against stores' use of the more universal greetings rather than the traditional "Merry Christmas." But it is not just conservatives who have changed their views from last year. In 2004, self-described liberals said the use of the universal greetings was a change for the better by a 68% to 18% margin. This year, liberals are evenly divided, with 43% saying it is for the worse, and 42% for the better.
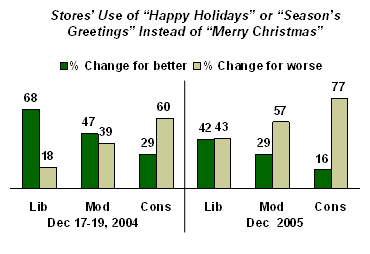
A more negative assessment of public institutions' use of the universal greetings this year compared to last is evident among most subgroups.
View of Use of Happy Holidays Instead of Merry Christmas, Selected Subgroups
|
2004 |
2005* |
|||
|
Change for |
Change for |
Change for |
Change for |
|
|
% |
% |
% |
% |
|
|
All Americans |
44 |
43 |
26 |
62 |
|
Democrat |
56 |
32 |
37 |
48 |
|
Independent |
45 |
39 |
30 |
57 |
|
Republican |
30 |
59 |
13 |
80 |
|
|
|
|
|
|
|
Liberal |
68 |
18 |
42 |
43 |
|
Moderate |
47 |
39 |
29 |
57 |
|
Conservative |
29 |
60 |
16 |
77 |
|
|
|
|
|
|
|
Weekly church |
31 |
59 |
17 |
75 |
|
Monthly church |
44 |
44 |
24 |
65 |
|
Seldom/Never |
52 |
32 |
33 |
51 |
|
|
|
|
|
|
|
18 to 29 |
60 |
23 |
48 |
43 |
|
30 to 49 |
47 |
40 |
26 |
62 |
|
50 to 64 |
39 |
51 |
20 |
67 |
|
65+ |
30 |
57 |
15 |
69 |
|
|
|
|
|
|
|
High school or less |
44 |
44 |
26 |
62 |
|
Some college |
43 |
43 |
24 |
64 |
|
College grad |
41 |
46 |
23 |
63 |
|
Postgrad |
46 |
40 |
34 |
53 |
|
|
|
|
|
|
|
Christian |
39 |
48 |
21 |
68 |
|
Non-Christian |
61 |
23 |
47 |
35 |
|
|
||||
|
*Based on combined data from Dec. 5-8 and Dec. 16-18 polls |
||||
The same patterns are evident in terms of which holiday greeting Americans would give to someone they just met -- with many more saying they would say "Merry Christmas" this year than last.
Preferred Holiday Greeting to Give, Selected Subgroups
|
2004 |
2005 |
|||
|
Merry |
Happy |
Merry |
Happy |
|
|
% |
% |
% |
% |
|
|
Democrat |
44 |
54 |
60 |
38 |
|
Independent |
54 |
43 |
64 |
34 |
|
Republican |
71 |
25 |
83 |
15 |
|
|
|
|
|
|
|
Liberal |
36 |
60 |
53 |
45 |
|
Moderate |
57 |
40 |
65 |
33 |
|
Conservative |
65 |
32 |
81 |
17 |
|
|
|
|
|
|
|
Weekly church |
66 |
31 |
81 |
17 |
|
Monthly church |
59 |
41 |
72 |
26 |
|
Seldom/Never |
49 |
47 |
58 |
39 |
|
|
|
|
|
|
|
18 to 29 |
55 |
44 |
51 |
46 |
|
30 to 49 |
50 |
46 |
65 |
34 |
|
50 to 64 |
58 |
38 |
73 |
24 |
|
65+ |
65 |
32 |
84 |
12 |
|
|
|
|
|
|
|
High school or less |
62 |
36 |
69 |
29 |
|
Some college |
53 |
42 |
75 |
22 |
|
College grad |
54 |
44 |
66 |
33 |
|
Postgrad |
51 |
45 |
58 |
40 |
|
|
|
|
|
|
|
Christian |
62 |
35 |
74 |
24 |
|
Non-Christian |
31 |
63 |
45 |
53 |
Survey Methods
These results are based on telephone interviews with a randomly selected national sample of 1,003 adults, aged 18 and older, conducted Dec. 16-19, 2005. For results based on this sample, one can say with 95% confidence that the maximum error attributable to sampling and other random effects is ±3 percentage points. In addition to sampling error, question wording and practical difficulties in conducting surveys can introduce error or bias into the findings of public opinion polls.
Next, thinking again about Christmas,
33. Do you celebrate Christmas?
|
Yes |
No |
No |
|
|
% |
% |
% |
|
|
2005 Dec 16-18 |
96 |
4 |
* |
|
|
|
|
|
|
2003 Dec 11-14 |
95 |
5 |
-- |
|
2000 Dec 2-4 |
96 |
4 |
* |
|
1994 Dec 16-18 |
96 |
4 |
* |
34. Thinking of the way you personally celebrate Christmas, is it a strongly religious holiday, somewhat religious or not too religious?
|
|
Strongly |
Somewhat |
Not too |
Don't celebrate |
No |
|
|
|
|
|
|
|
|
2005 Dec 16-18 |
47% |
30 |
19 |
4 |
* |
|
|
|
|
|
|
|
|
1989 Oct 12-15 |
38% |
37 |
19 |
6 |
* |
35. How much stress or pressure do you usually feel from all the things you have to do to get ready for Christmas -- a great deal, a fair amount, some, not too much, or none at all?
|
Great deal |
Fair amount |
|
Not too much |
None |
Don't celebrate |
No |
|
|
|
|
|
|
|
|
|
|
|
2005 Dec 16-18 |
14% |
23 |
23 |
23 |
13 |
4 |
* |
|
|
|
|
|
|
|
|
|
|
1989 Oct 12-15^ |
15% |
20 |
20 |
24 |
15 |
6 |
-- |
|
|
|
|
|
|
|
|
|
|
^WORDING: How much pressure do you usually feel from all the things you have to do to get ready for Christmas? |
|||||||
36. Which of the following best describes the way you feel about Christmas -- it is the best time of the year for you, it is a great time, it is a good time, it is neither a good nor a bad time, or it is a bad time for you?
|
Best |
|
|
Neither good |
|
Don't |
|
|
|
|
|
|
|
|
|
|
|
|
2005 Dec 16-18 |
15% |
35 |
35 |
8 |
3 |
4 |
* |
37. Thinking now about some of the things people do around Christmas, such as decorating the house, having parties, or baking cookies, how much time and effort do you spend on these activities compared to other people you know? Do you spend -- [ROTATED: a lot more time, a little more time, a little less time, (or) a lot less time]?
|
A lot |
A little |
A little |
A lot |
Don't |
No |
|
|
|
|
|
|
|
|
|
|
2005 Dec 16-18 |
12% |
30 |
32 |
22 |
4 |
* |