GALLUP NEWS SERVICE
PRINCETON, NJ -- Jan. 20 marks the beginning of George W. Bush's sixth year in office, closing the book on a rough fifth year. After beginning his second term with a 51% job approval rating, Bush's rating fell to as low as 37% in November, establishing a new personal low. His rating has recovered somewhat in recent weeks and currently stands at 43%, according to a Jan. 9-12 Gallup Poll. However, the marks for Bush's most recent year and most recent quarter in office are the worst of his presidency.
For the year beginning Jan. 20, 2005, and ending Jan. 19, 2006, Bush averaged a 45.8% job approval rating. After getting a short-lived bump to 57% following the successful Iraqi elections in late January, Bush's approval rating fell to the low 50s by mid-February. It stayed below 50% after early May and dipped below 40% in mid-October. In mid-November, just 37% approved of Bush, the lowest mark of his presidency. By early December, Bush's approval rating began to show signs of recovery, and it has held steady in the low 40s since then.

Bush's yearly average has declined significantly in each of the last three years. His first- and second-year averages were among the best of any recent president.

Not only is Bush's fifth year average of 45.8% the worst of his presidency, it (along with Bill Clinton's similar 46.0% average in 1994-1995) is also the lowest for any president in over a decade. The last president with a lower yearly average was Bush's father, the elder George Bush, who averaged 41.2% in 1992-1993.
In a larger context, Bush's fifth year ranks just 48th out of 63 "presidential years" for which Gallup has data, dating back to the Truman presidency.
Most presidents' fifth years in office coincide with the beginning of their second terms, usually following a strong public mandate in the previous year's election. Given that Bush's two-point margin of victory over John Kerry in 2004 was the smallest for a successful incumbent since 1916, Bush started out the year in a weaker popular position than most other fifth-year presidents.
As a result, it is not surprising that Bush's fifth-year job approval average pales in comparison with those for other chief executives, particularly those who had been recently re-elected. Four presidents who served a fifth year had averages over 50% for that year -- Harry Truman (50.2%), Dwight Eisenhower (62.8%), Ronald Reagan (60.4%), and Bill Clinton (57.9%). Bush's average is slightly better than Lyndon Johnson's 43.9% and Richard Nixon's 41.1%. Both Johnson and Nixon were nearing the end of their presidencies during their fifth years in office, Johnson due to the unpopular Vietnam War and Nixon due to his involvement in the Watergate scandal.
|
Recent Presidents' Fifth-Year Job Approval Averages |
|||
|
President |
Dates of Fifth Year |
Average |
Number of |
|
|
|
||
|
Truman |
Jan. 20, 1949-Jan. 19, 1950 |
50.2% |
5 |
|
Eisenhower |
Jan. 20, 1957-Jan. 19, 1958 |
62.8% |
15 |
|
Johnson |
Jan. 20, 1967-Jan. 19, 1968 |
43.9% |
17 |
|
Nixon |
Jan. 20, 1973-Jan. 19, 1974 |
41.1% |
21 |
|
Reagan |
Jan. 20, 1985-Jan. 19, 1986 |
60.4% |
15 |
|
Clinton |
Jan. 20, 1997-Jan. 19, 1998 |
57.9% |
19 |
|
George W. Bush |
Jan. 20, 2005-Jan. 19, 2006 |
45.8% |
42 |
Bush's Most Recent Quarter Also Sets New Low
Bush's most recent quarterly average, for his 20th quarter in office, also marks the worst of his presidency, at 41.2% The trend line on Bush's quarterly averages also point down. Since his record 86% average following the Sept. 11 terrorist attacks, Bush has seen at least some decline in his quarterly average in all but three quarters.
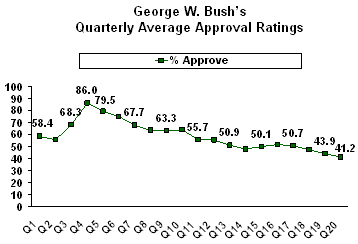
Bush's latest quarterly average ranks in just the 13th percentile of all presidential quarterly averages since Truman's presidency. It also is the worst quarterly average for a president since his father's 35.2% average from July 20-Oct. 19, 1992.
Eisenhower, Clinton, and Reagan had much higher quarterly averages in their 20th quarters in office, all at 59% or better. Truman's and Johnson's averages were slightly lower than Bush's, just below 40%. Nixon's 28% average is one of the worst ever, and his quarterly averages continued to decline leading up to his resignation from office.
|
Presidents' Twentieth-Quarter Averages |
|||
|
President |
Dates of Twentieth Qtr. |
Average |
Number of |
|
|
|
||
|
Truman |
Jan. 20-April 19, 1950 |
37.0% |
1 |
|
Eisenhower |
Oct. 20, 1957-Jan. 19, 1958 |
59.0% |
2 |
|
Johnson |
July 20-Oct. 19, 1968 |
38.5% |
2 |
|
Nixon |
Oct. 20, 1973-Jan. 19, 1974 |
28.0% |
5 |
|
Reagan |
Oct. 20, 1985-Jan. 19, 1986 |
63.5% |
4 |
|
Clinton |
Oct. 20, 1997-Jan. 19, 1998 |
59.0% |
6 |
|
George W. Bush |
Oct. 20, 2005-Jan. 19, 2006 |
41.2% |
12 |
Survey Methods
These results are based on telephone interviews with randomly selected national samples, each of approximately 1,000 adults, aged 18 and older. For results based on these samples, one can say with 95% confidence that the maximum error attributable to sampling and other random effects is ±3 percentage points. In addition to sampling error, question wording and practical difficulties in conducting surveys can introduce error or bias into the findings of public opinion polls.