Story Highlights
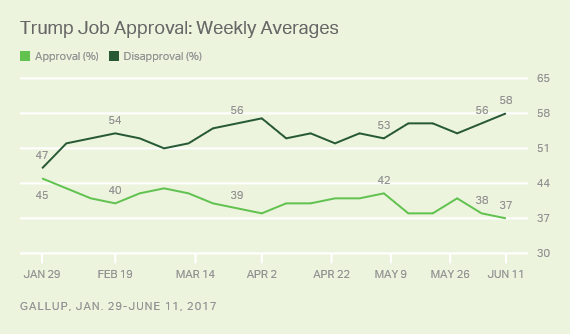
- Trump's approval at 37%; previous weekly low average was 38%
- His weekly disapproval rating of 58% is highest of his administration
- 8% of Democrats approve, contrasted with 83% of Republicans
WASHINGTON, D.C. -- President Donald Trump's job approval weekly average edged down to 37% during the week ending June 11. This rating is one percentage point below the previous week's rating and is the lowest weekly average of his administration. His disapproval rating for the same week, 58%, was his highest to date.

Trump has averaged 40% approval and 54% disapproval across the 20 full weeks of his administration. Trump's approval rating started out as the lowest for any new president in Gallup's records. His weekly approval and disapproval ratings have remained consistent, for the most part registering within three points above or below their overall averages.
Last week's 37% weekly average is the bottom end of his range of approval ratings, although not significantly different than his 38% average rating the week before, or than the two weeks of 38% averages in mid-May (May 8-21).
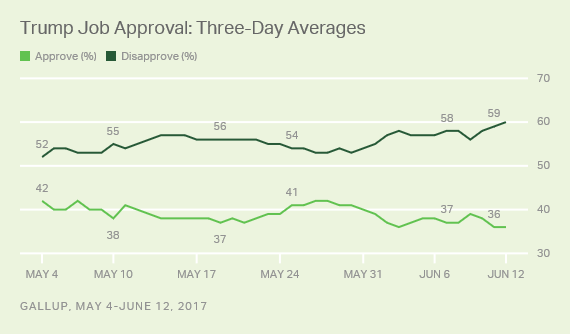
Trump's approval ratings are also near his administration's low point when looking at the three-day approval ratings Gallup reports daily. For June 10-12, Trump averaged 36% approval, one point above his low of 35% measured March 26-28. Trump's current three-day average of 60% disapproval is, by one point, the highest of his administration.

Impact of Paris Agreement Withdrawal, Comey Testimony Not Clear
Despite the president's claim on Monday at a Cabinet meeting that "Never has there been a president, with few exceptions -- in the case of F.D.R. he had a major Depression to handle -- who's passed more legislation, who's done more things than what we've done," his administration has been roiled by controversies.
Most recently, Trump ran into a buzz saw of criticism with his decision, announced June 1, to withdraw the U.S. from participation in the Paris climate accord. He has also been under significant political scrutiny over the June 8 testimony of former FBI Director James Comey before the Senate Intelligence Committee.
Those events coincided with the lower averages seen in the past two weeks. But, given that his averages were almost as low in the weeks leading up to them, it is difficult to establish direct causality between specific events and the president's ratings.
High Levels of Polarization in Views of Trump Continue
The highly polarized nature of Americans' views of Trump (and Obama before him) have been well-documented, and that pattern continues:
- Trump's 8% average approval rating among Democrats last week is right at his 9% average to date.
- His 83% approval among Republicans is three points lower than his average among that group.
- Among independents, his approval is 31%, five points lower than his average among that group.
Bottom Line
Trump's job approval ratings are among the worst of his administration so far, with his latest weekly average his lowest by one point and his three-day average just above the low point of 35% recorded in March.
Trump's approval ratings have bounced back from previous low points to levels above 40%, but this time Trump seems to be in a more sustained slump, with his rating averaging below 40% for four of the past five weeks.
Trump continues to have the lowest ratings for a newly elected president in Gallup's history of approval ratings. The previous low first-year approval rating in June for an elected president was Bill Clinton, with a 37% approval June 5-6, 1993. The approval ratings of all other presidents since 1953 in June (May in the case of Eisenhower) of their first year after being elected were above 50%.
Historical data are available in Gallup Analytics.
Explore Trump's approval ratings in depth and compare them with those of past presidents in the Gallup Presidential Job Approval Center.
Survey Methods
Results for this Gallup poll are based on telephone interviews conducted June 5-11, 2017, on the Gallup U.S. Daily survey, with a random sample of 3,552 adults, aged 18 and older, living in all 50 U.S. states and the District of Columbia. For results based on the total sample of national adults, the margin of sampling error is ±2 percentage points at the 95% confidence level. All reported margins of sampling error include computed design effects for weighting.
Each sample of national adults includes a minimum quota of 70% cellphone respondents and 30% landline respondents, with additional minimum quotas by time zone within region. Landline and cellular telephone numbers are selected using random-digit-dial methods.


