GALLUP NEWS SERVICE
PRINCETON, NJ -- Of 10 environment issues facing the nation today, Americans express the greatest amount of concern about issues relating to water pollution, according to Gallup's recent survey on the environment. Concerns about six of the environmental issues -- global warming, damage to the ozone layer, air pollution, loss of tropical rain forests, contamination of soil and water by toxic waste, and acid rain -- are up this year. On all six, Americans have expressed greater concern at times in the past than they do now. Republicans are much less likely than independents or Democrats to say they worry about all of these environmental issues.
Overall Results
The poll, conducted Mar. 13-16, 2006, finds Americans greatest environmental concerns center around those involving different aspects of water pollution. A majority say they worry a great deal about pollution of drinking water (54%), contamination of soil and water by toxic waste (52%) and pollution of rivers, lakes, and reservoirs (51%). Just under half, 49%, express this degree of concern over maintaining the nation's supply of fresh water for household needs.
Roughly 4 in 10 Americans say they worry a great deal about air pollution (44%), damage to the Earth's ozone layer (40%), and the loss of tropical rain forests (40%). Americans show the least amount of concern about global warming (36%), the extinction of plant and animal species (34%), and acid rain (24%).
|
Environmental Concerns |
|||
|
|
|
Great |
|
|
% |
% |
% |
|
|
Pollution of drinking water |
54 |
27 |
81 |
|
Contamination of soil and water by toxic waste |
52 |
29 |
81 |
|
Pollution of rivers, lakes, and reservoirs |
51 |
33 |
84 |
|
Maintenance of the nation's supply of fresh water for household needs |
49 |
27 |
76 |
|
Air pollution |
44 |
34 |
78 |
|
Damage to the Earth's ozone layer |
40 |
28 |
68 |
|
The loss of tropical rain forests |
40 |
24 |
64 |
|
The "greenhouse effect" or global warming |
36 |
26 |
62 |
|
Extinction of plant and animal species |
34 |
29 |
63 |
|
Acid rain |
24 |
28 |
52 |
Changes in Concern
The public's overall level of concern of six of the issues is significantly higher now than it was two years ago, when Gallup last asked this question. Despite the increases, Americans' concern still falls short of where it has been in recent years.
|
Changes in Environmental Concerns |
|||
|
2006 |
2004 |
Change |
|
|
% |
% |
% |
|
|
The "greenhouse effect" or global warming |
36 |
26 |
+10 |
|
Damage to the Earth's ozone layer |
40 |
33 |
+7 |
|
Air pollution |
44 |
39 |
+5 |
|
The loss of tropical rain forests |
40 |
35 |
+5 |
|
Contamination of soil and water by toxic waste |
52 |
48 |
+4 |
|
Acid rain |
24 |
20 |
+4 |
|
Pollution of rivers, lakes, and reservoirs |
51 |
48 |
+3 |
|
Maintenance of the nation's supply of fresh water for household |
49 |
47 |
+2 |
|
Pollution of drinking water |
54 |
53 |
+1 |
|
Extinction of plant and animal species |
34 |
36 |
-2 |
Here is the detailed look at the six issues where the public's level of concern is higher now than it was in 2004:
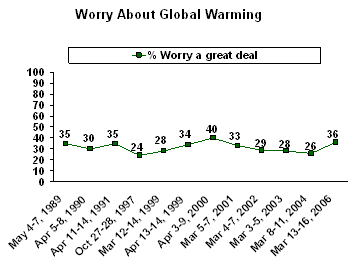
Global warming. Americans' concern about global warming shows the largest increase this year, from 26% expressing a great deal of concern in 2004 to 36% today. Concern about global warming was at roughly the same level as it is now when Gallup first asked the question in 1989. Throughout the 1990s, the percentage of Americans who said they worried a great deal about global warming fluctuated, ranging between 24% (the lowest point for this measure) and 35%. Concern reached a high point in 2000, when 40% said they worried a great deal. This sentiment gradually declined from 2001 through 2004 before increasing again this year.
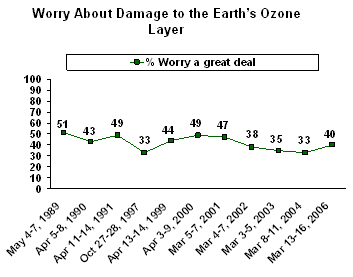
Damage to the Earth's ozone layer. In 2004, 33% of Americans said they worried a great deal about damage to the ozone layer; now, 40% report that degree of concern. Concern about this issue was highest in 1989 when 51% said they worried a great deal about the depletion of the ozone layer. The low point came in 1997 and again in 2004, when 1 in 3 Americans said they were worried.
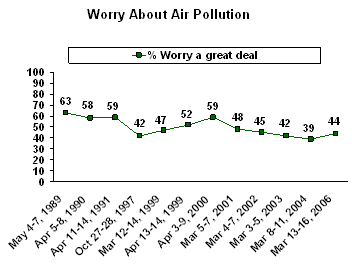
Air pollution. The public's concern about air pollution was substantially higher when Gallup first asked this question in the late 1980s and early 1990s, with roughly 6 in 10 Americans saying they worried a great deal about it. Concern dropped by the late 1990s, before increasing once again in 2000. Then, the percentage of Americans worried about air pollution gradually decreased over the next several years, reaching a low point of 39% in 2004, before increasing five points this year to 44%.
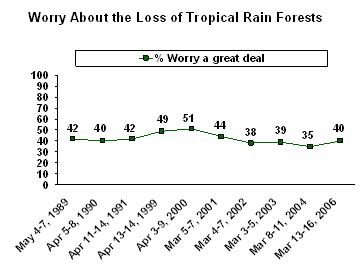
The loss of tropical rain forests. Forty percent of Americans currently say they worry a great deal about the loss of tropical rain forests; this is up five points since 2004. The current level of concern is roughly what Gallup found from 1989 through 1991. This sentiment increased in 1999 and 2000, with roughly half of Americans saying they were worried about this issue. As is the case with other issues discussed here, concerns started to decline after that, reaching a low of 35% in 2004, before edging up again this year.
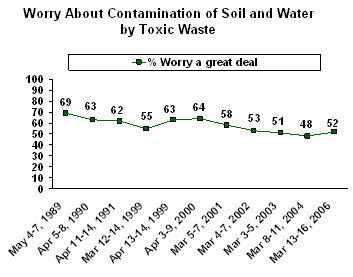
Contamination of soil and water by toxic waste. The highest level of concern about soil and water contamination occurred in 1989 when 69% of Americans said they were worried a great deal about this problem. With the exception of a March 1999 poll, concern about this issue remained in the 60%-range until 2001, at which point, it began to decline gradually, reaching a low point of 48% in 2004. Now, the public's worry about soil and water contamination is up slightly to 52%.
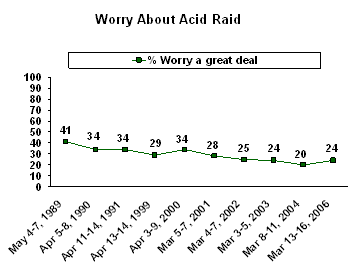
Acid rain. Nearly 1 in 4 Americans (24%) says they worry a great deal about acid rain. This is up slightly from Gallup's 2004 survey -- when concerns were at their historical low point -- but it is now at the same level Gallup measured in 2002 and 2003. Concerns about acid rain were highest in 1989, when 41% expressed concern about it. Since 2001, the percentage expressing high levels of concern have consistently been below 30%.
Republicans Less Concerned Than Democrats About Environmental Issues
Republicans are much less likely than independents or Democrats to express concern about any of the environmental issues.
|
Environmental Concerns by Party Affiliation Mar. 13-16, 2006 |
|||||
|
Repu- |
Indep- |
Demo- |
Rep. minus |
||
|
% |
% |
% |
|
||
|
The "greenhouse effect" or global warming |
16 |
38 |
49 |
-33 |
|
|
Air pollution |
28 |
44 |
58 |
-30 |
|
|
Damage to the Earth's ozone layer |
24 |
42 |
50 |
-26 |
|
|
Contamination of soil and water by toxic waste |
39 |
52 |
61 |
-22 |
|
|
Pollution of drinking water |
42 |
54 |
62 |
-20 |
|
|
Pollution of rivers, lakes, and reservoirs |
39 |
52 |
59 |
-20 |
|
|
The loss of tropical rain forests |
28 |
43 |
47 |
-19 |
|
|
Maintenance of the nation's supply of fresh water for |
40 |
50 |
57 |
-17 |
|
|
Acid rain |
14 |
25 |
30 |
-16 |
|
|
Extinction of plant and animal species |
25 |
34 |
40 |
-15 |
|
- Republicans' top environment concern is pollution of drinking water, but only 42% say they are worried a great deal about this issue. This is also the top issue among Democrats, but with 62% expressing concern about drinking water pollution.
- The largest partisan gaps in concern are found on global warming (49% among Democrats vs. 16% among Republicans) and air pollution (58% vs. 28%).
- There is at least a 20-percentage point difference between Democrats and Republicans in their expressed concern on four additional issues: damage to the Earth's ozone layer (50% vs. 24%); contamination of soil and water by toxic waste (61% vs. 39%); pollution of drinking water (62% vs. 42%); and pollution of rivers, lakes, and reservoirs (59% vs. 39%).
- The issues with the smallest partisan differences include the loss of tropical rain forests (47% vs. 28%), maintaining the nation's supply of fresh water for household needs (57% vs. 40%), acid rain (30% vs. 14%), and extinction of plants and animal species (40% vs. 25%).
Survey Methods
Results are based on telephone interviews with 1,000 national adults, aged 18 and older, conducted Mar. 13-16, 2006. For results based on the total sample of national adults, one can say with 95% confidence that the margin of sampling error is ±3 percentage points. In addition to sampling error, question wording and practical difficulties in conducting surveys can introduce error or bias into the findings of public opinion polls.
22. I'm going to read you a list of environmental problems. As I read each one, please tell me if you personally worry about this problem a great deal, a fair amount, only a little, or not at all. First, how much do you personally worry about -- [RANDOM ORDER]?
Full Trends: Environmental Worries
A. Pollution of rivers, lakes, and reservoirs
|
Great |
Fair |
Only a |
Not |
No |
|
|
% |
% |
% |
% |
% |
|
|
2006 Mar 13-16 |
51 |
33 |
11 |
5 |
* |
|
|
|
|
|
|
|
|
2004 Mar 8-11 |
48 |
31 |
16 |
5 |
* |
|
2003 Mar 3-5 |
51 |
31 |
13 |
5 |
-- |
|
2002 Mar 4-7 |
53 |
32 |
12 |
3 |
* |
|
2001 Mar 5-7 |
58 |
29 |
10 |
3 |
* |
|
2000 Apr 3-9 |
66 |
24 |
8 |
2 |
* |
|
1999 Apr 13-14 |
61 |
30 |
7 |
2 |
* |
|
1999 Mar 12-14 |
55 |
30 |
12 |
3 |
* |
|
1991 Apr 11-14 |
67 |
21 |
8 |
3 |
1 |
|
1990 Apr 5-8 |
64 |
23 |
9 |
4 |
-- |
|
1989 May 4-7 |
72 |
19 |
5 |
3 |
1 |
|
* Less than 0.5% |
|||||
B. Air pollution
|
Great |
Fair |
Only a |
Not |
No |
|
|
% |
% |
% |
% |
% |
|
|
2006 Mar 13-16 |
44 |
34 |
15 |
7 |
* |
|
|
|
|
|
|
|
|
2004 Mar 8-11 |
39 |
30 |
23 |
8 |
* |
|
2003 Mar 3-5 |
42 |
32 |
20 |
6 |
* |
|
2002 Mar 4-7 |
45 |
33 |
18 |
4 |
* |
|
2001 Mar 5-7 |
48 |
34 |
14 |
4 |
* |
|
2000 Apr 3-9 |
59 |
29 |
9 |
3 |
* |
|
1999 Apr 13-14 |
52 |
35 |
10 |
3 |
* |
|
1999 Mar 12-14 |
47 |
33 |
16 |
4 |
* |
|
1997 Oct 27-28 |
42 |
34 |
18 |
5 |
1 |
|
1991 Apr 11-14 |
59 |
28 |
10 |
4 |
* |
|
1990 Apr 5-8 |
58 |
29 |
9 |
4 |
* |
|
1989 May 4-7 |
63 |
24 |
8 |
4 |
* |
|
* Less than 0.5% |
|||||
C. Damage to the Earth's ozone layer
|
Great |
Fair |
Only a |
Not |
No |
|
|
% |
% |
% |
% |
% |
|
|
2006 Mar 13-16 |
40 |
28 |
19 |
13 |
* |
|
|
|
|
|
|
|
|
2004 Mar 8-11 |
33 |
27 |
26 |
14 |
* |
|
2003 Mar 3-5 |
35 |
31 |
21 |
12 |
1 |
|
2002 Mar 4-7 |
38 |
29 |
21 |
11 |
1 |
|
2001 Mar 5-7 |
47 |
28 |
16 |
8 |
1 |
|
2000 Apr 3-9 |
49 |
29 |
14 |
7 |
1 |
|
1999 Apr 13-14 |
44 |
32 |
15 |
8 |
1 |
|
1997 Oct 27-28 |
33 |
27 |
25 |
13 |
2 |
|
1991 Apr 11-14 |
49 |
24 |
16 |
8 |
4 |
|
1990 Apr 5-8 |
43 |
28 |
15 |
10 |
4 |
|
1989 May 4-7 |
51 |
26 |
13 |
8 |
2 |
|
* Less than 0.5% |
|||||
D. The loss of tropical rain forests
|
Great |
Fair |
Only a |
Not |
No |
|
|
% |
% |
% |
% |
% |
|
|
2006 Mar 13-16 |
40 |
24 |
22 |
13 |
1 |
|
|
|
|
|
|
|
|
2004 Mar 8-11 |
35 |
26 |
23 |
15 |
1 |
|
2003 Mar 3-5 |
39 |
29 |
21 |
11 |
* |
|
2002 Mar 4-7 |
38 |
27 |
21 |
12 |
2 |
|
2001 Mar 5-7 |
44 |
32 |
15 |
8 |
1 |
|
2000 Apr 3-9 |
51 |
25 |
14 |
9 |
1 |
|
1999 Apr 13-14 |
49 |
30 |
14 |
6 |
1 |
|
1991 Apr 11-14 |
42 |
25 |
21 |
10 |
2 |
|
1990 Apr 5-8 |
40 |
24 |
19 |
14 |
3 |
|
1989 May 4-7 |
42 |
25 |
18 |
12 |
3 |
|
* Less than 0.5% |
|||||
E. The "greenhouse effect" or global warming
|
Great |
Fair |
Only a |
Not |
No |
|
|
|
|
|
|
|
|
|
2006 Mar 13-16 |
36 |
26 |
21 |
15 |
1 |
|
|
|
|
|
|
|
|
2004 Mar 8-11 |
26 |
25 |
28 |
19 |
2 |
|
2003 Mar 3-5 |
28 |
30 |
23 |
17 |
2 |
|
2002 Mar 4-7 |
29 |
29 |
23 |
17 |
2 |
|
2001 Mar 5-7 |
33 |
30 |
22 |
13 |
2 |
|
2000 Apr 3-9 |
40 |
32 |
15 |
12 |
1 |
|
1999 Apr 13-14 |
34 |
34 |
18 |
12 |
2 |
|
1999 Mar 12-14 |
28 |
31 |
23 |
16 |
2 |
|
1997 Oct 27-28 |
24 |
26 |
29 |
17 |
4 |
|
1991 Apr 11-14 |
35 |
27 |
22 |
12 |
5 |
|
1990 Apr 5-8 |
30 |
27 |
20 |
16 |
6 |
|
1989 May 4-7 |
35 |
28 |
18 |
12 |
7 |
F. Contamination of soil and water by toxic waste
|
Great |
Fair |
Only a |
Not |
No |
|
|
% |
% |
% |
% |
% |
|
|
2006 Mar 13-16 |
52 |
29 |
13 |
6 |
* |
|
|
|
|
|
|
|
|
2004 Mar 8-11 |
48 |
26 |
21 |
5 |
* |
|
2003 Mar 3-5 |
51 |
28 |
16 |
5 |
* |
|
2002 Mar 4-7 |
53 |
29 |
15 |
3 |
* |
|
2001 Mar 5-7 |
58 |
27 |
12 |
3 |
* |
|
2000 Apr 3-9 |
64 |
25 |
7 |
4 |
* |
|
1999 Apr 13-14 |
63 |
27 |
7 |
3 |
* |
|
1999 Mar 12-14 |
55 |
29 |
11 |
5 |
* |
|
1991 Apr 11-14 |
62 |
21 |
11 |
5 |
1 |
|
1990 Apr 5-8 |
63 |
22 |
10 |
5 |
* |
|
1989 May 4-7 |
69 |
21 |
6 |
3 |
* |
|
* Less than 0.5% |
|||||
G. Acid rain
|
Great |
Fair |
Only a |
Not |
No |
|
|
% |
% |
% |
% |
% |
|
|
2006 Mar 13-16 |
24 |
28 |
24 |
23 |
1 |
|
|
|
|
|
|
|
|
2004 Mar 8-11 |
20 |
26 |
27 |
26 |
1 |
|
2003 Mar 3-5 |
24 |
26 |
27 |
21 |
2 |
|
2002 Mar 4-7 |
25 |
23 |
31 |
19 |
2 |
|
2001 Mar 5-7 |
28 |
28 |
26 |
16 |
2 |
|
2000 Apr 3-9 |
34 |
31 |
19 |
15 |
1 |
|
1999 Apr 13-14 |
29 |
35 |
23 |
11 |
2 |
|
1991 Apr 11-14 |
34 |
30 |
20 |
14 |
3 |
|
1990 Apr 5-8 |
34 |
30 |
18 |
14 |
4 |
|
1989 May 4-7 |
41 |
27 |
19 |
11 |
3 |
H. Pollution of drinking water
|
Great |
Fair |
Only a |
Not |
No |
|
|
% |
% |
% |
% |
% |
|
|
2006 Mar 13-16 |
54 |
27 |
12 |
7 |
* |
|
|
|
|
|
|
|
|
2004 Mar 8-11 |
53 |
24 |
17 |
6 |
* |
|
2003 Mar 3-5 |
54 |
25 |
15 |
6 |
-- |
|
2002 Mar 4-7 |
57 |
25 |
13 |
5 |
* |
|
2001 Mar 5-7 |
64 |
24 |
9 |
3 |
* |
|
2000 Apr 3-9 |
72 |
20 |
6 |
2 |
* |
|
1999 Apr 13-14 |
68 |
22 |
7 |
3 |
* |
|
1991 Apr 11-4 |
67 |
19 |
10 |
3 |
1 |
|
1990 Apr 5-8 |
65 |
22 |
9 |
4 |
* |
|
* Less than 0.5% |
|||||
I. Extinction of plant and animal species
|
Great |
Fair |
Only a |
Not |
No |
|
|
% |
% |
% |
% |
% |
|
|
2006 Mar 13-16 |
34 |
29 |
23 |
14 |
1 |
|
|
|
|
|
|
|
|
2004 Mar 8-11 |
36 |
26 |
23 |
15 |
* |
|
2003 Mar 3-5 |
34 |
32 |
21 |
12 |
1 |
|
2002 Mar 4-7 |
35 |
30 |
22 |
12 |
1 |
|
2001 Mar 5-7 |
43 |
30 |
19 |
7 |
1 |
|
2000 Apr 3-9 |
45 |
33 |
14 |
8 |
* |
|
* Less than 0.5% |
|||||
J. Maintenance of the nation's supply of fresh water for household needs
|
Great |
Fair |
Only a |
Not |
No |
|
|
|
|
|
|
|
|
|
2006 Mar 13-16 |
49 |
27 |
14 |
9 |
1 |
|
|
|
|
|
|
|
|
2004 Mar 8-11 |
47 |
25 |
20 |
8 |
* |
|
2003 Mar 3-5 |
49 |
28 |
15 |
8 |
* |
|
2002 Mar 4-7 |
50 |
28 |
17 |
5 |
* |
|
2001 Mar 5-7 |
35 |
34 |
19 |
10 |
2 |
|
2000 Apr 3-9 |
42 |
31 |
14 |
12 |
1 |
|
* Less than 0.5% |
|||||