Story Highlights
- Fewer than four in 10 Catholics attend church in any given week
- Catholic attendance is down six percentage points over the past decade
- Protestant attendance steady, but fewer Americans now identify as Protestants
WASHINGTON, D.C. -- Weekly church attendance has declined among U.S. Catholics in the past decade, while it has remained steady among Protestants.
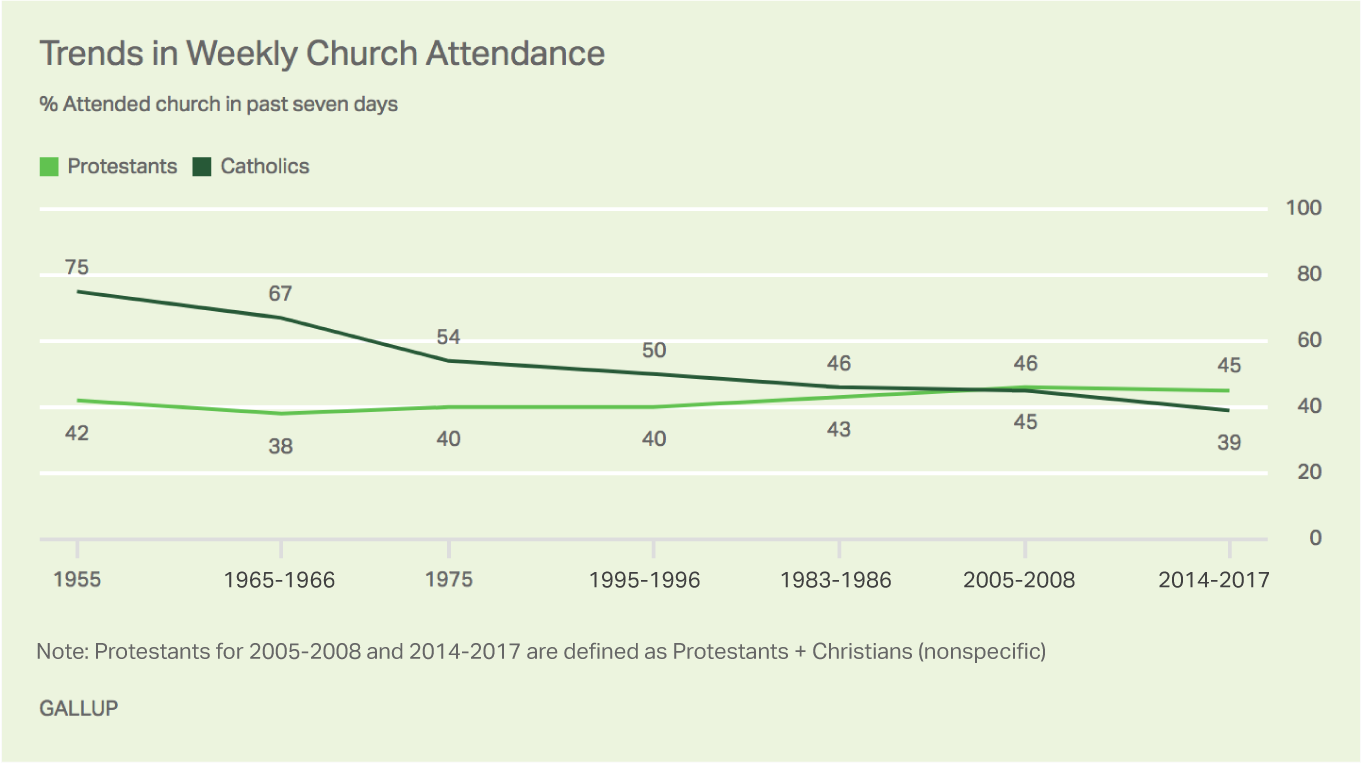
From 2014 to 2017, an average of 39% of Catholics reported attending church in the past seven days. This is down from an average of 45% from 2005 to 2008 and represents a steep decline from 75% in 1955.
By contrast, the 45% of Protestants who reported attending church weekly from 2014 to 2017 is essentially unchanged from a decade ago and is largely consistent with the long-term trend.
As Gallup first reported in 2009, the steepest decline in church attendance among U.S. Catholics occurred between the 1950s and 1970s, when the percentage saying they had attended church in the past seven days fell by more than 20 percentage points. It then fell an average of four points per decade through the mid-1990s before stabilizing in the mid-2000s. Since then, the downward trend has resumed, with the percentage attending in the past week falling another six points in the past decade.
This analysis is based on multiple Gallup surveys conducted near the middle of each decade from the 1950s through the present. The data for each period provide sufficient sample sizes to examine church attendance among Protestants and Catholics, the two largest religious groups in the country, as well as the patterns by age within those groups. The sample sizes are not sufficient to allow for analysis of specific Protestant denominations or non-Christian religions.
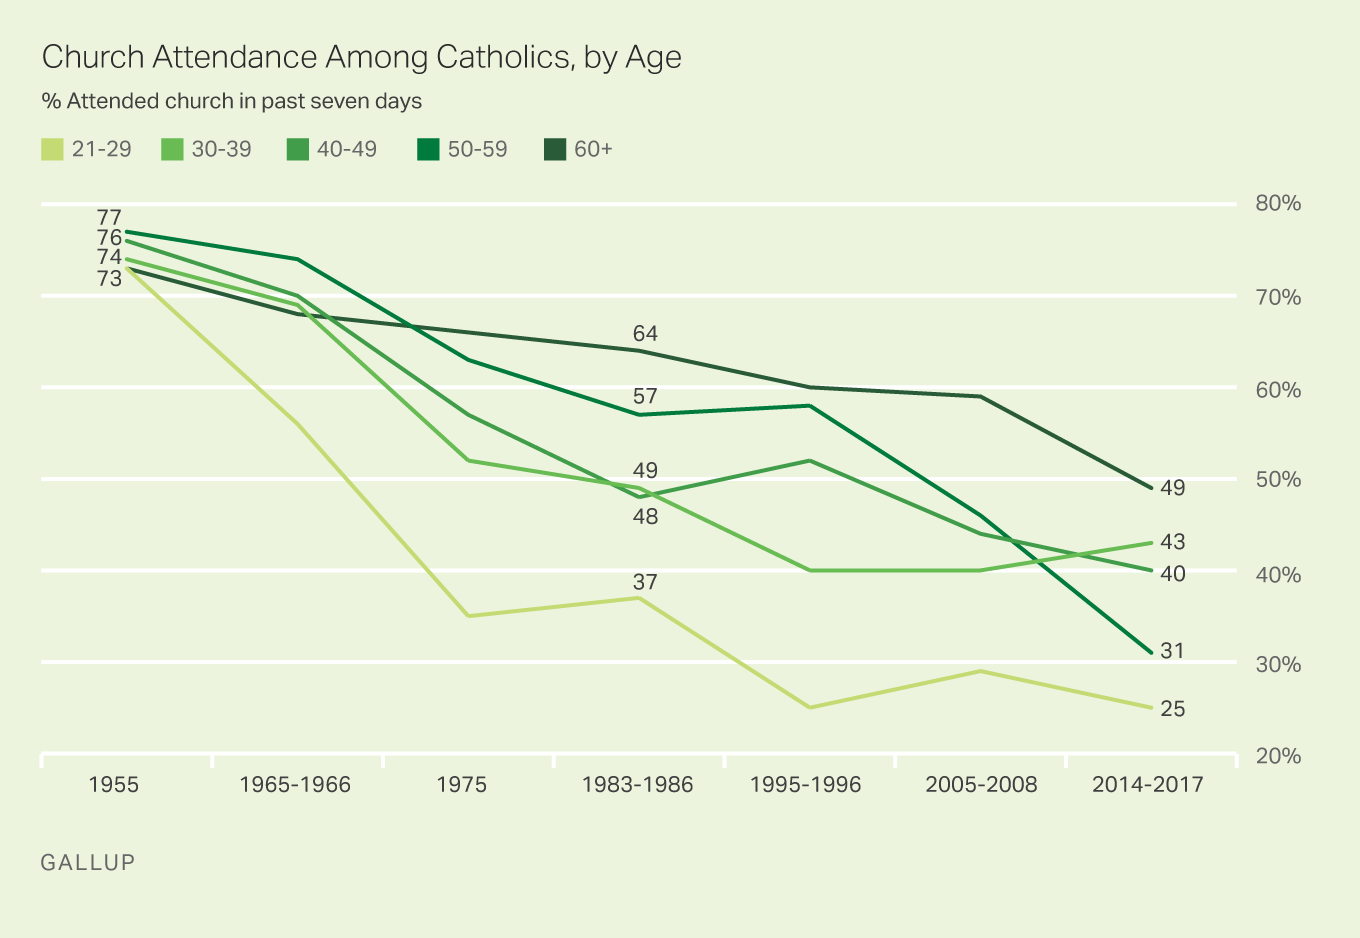
Less Than Half of Older Catholics Are Now Weekly Churchgoers
In 1955, practicing Catholics of all age groups largely complied with their faith's weekly mass obligation. At that time, roughly three in four Catholics, regardless of their age, said they had attended church in the past week. This began to change in the 1960s, however, as young Catholics became increasingly less likely to attend. The decline accelerated through the 1970s and has since continued at a slower pace. (See tables at the end of this article for all trend figures.)
Meanwhile, since 1955, there has also been a slow but steady decline in regular church attendance among older Catholics. This includes declines of 10 points or more in just the past decade among Catholics aged 50 and older, leading to the current situation where no more than 49% of Catholics in any age category report attending church in the past week.
To maintain consistency with earlier Gallup polling when the sample population was age 21 and older, this analysis defines the youngest age group as those aged 21 to 29 rather than the 18- to 29-year age range typically examined in modern polling.
Attendance Holding Up Among Protestants of All Ages
U.S. Protestants' church attendance was not nearly as high as Catholics' in the 1950s -- but it has not decreased over time. Protestants' church attendance dipped in the 1960s and 1970s among those aged 21 to 29, but it has since rebounded. Among those aged 60 and older, weekly attendance has grown by eight points since the 1950s. (See tables at the end of this article for all trend figures.)
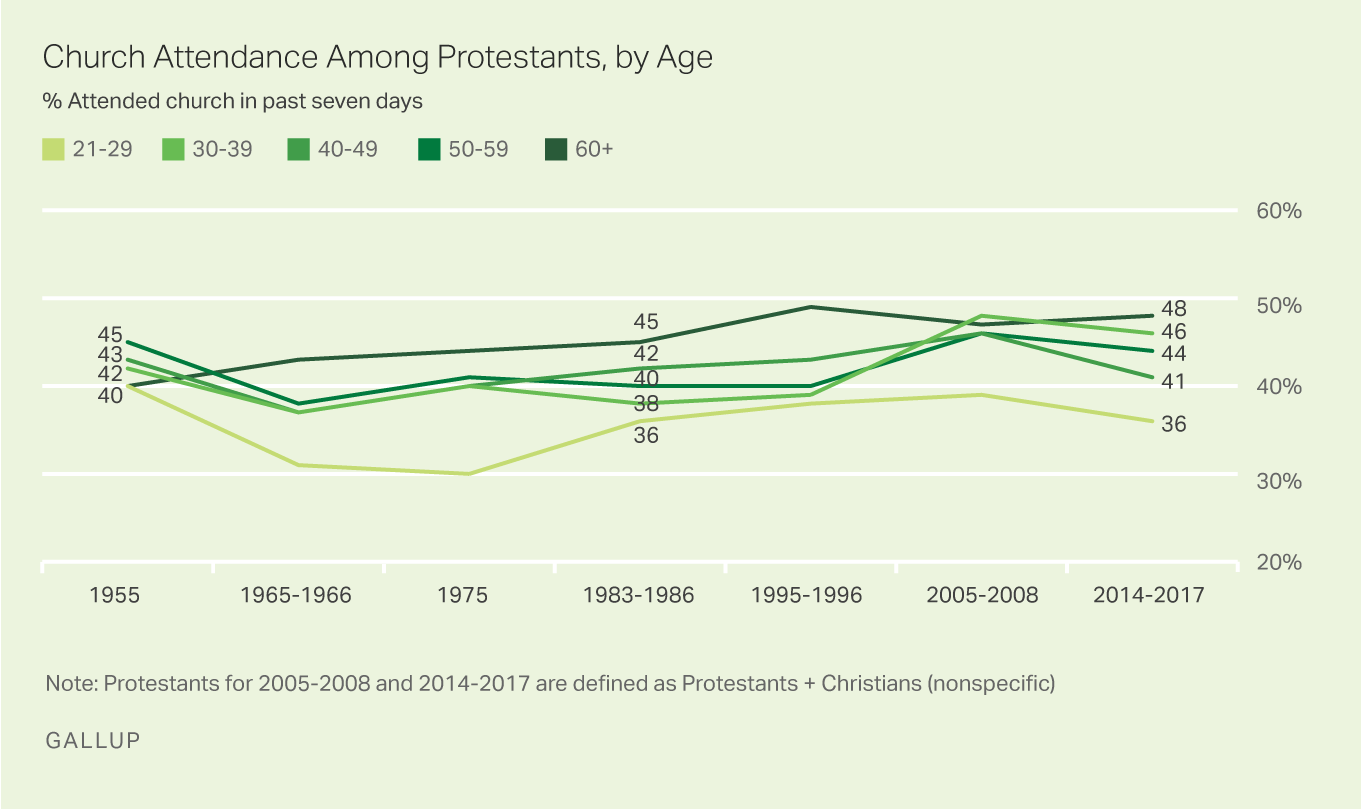
Currently, the rate of weekly church attendance among Protestants and Catholics is similar at most age levels. One exception is among those aged 21 to 29, with Protestants (36%) more likely than Catholics (25%) to say they have attended in the past seven days.
Protestants' Pie Is Shrinking Faster Than Catholics'
While attracting parishioners to weekly services is vital to the maintenance of the Catholic Church and Protestant denominations alike, so too is maintaining a large base of Americans identifying with each faith group.
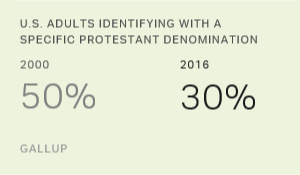
Although the rate at which Protestants attend church has held firm over the past six decades, the percentage of Americans identifying as Protestant has declined sharply, from 71% in 1955 to 47% in the mid-2010s. Since 1999, Gallup's definition of Protestants has included those using the generic term "Christian" as well as those calling themselves Protestant or naming a specific Protestant faith.
By contrast, while the Catholic Church has suffered declining attendance in the U.S., the overall percentage of Catholics has held fairly steady -- largely because of the growth of the U.S. Hispanic population. Twenty-two percent of U.S. adults today identify as Catholic, compared with 24% in 1955.
A troubling sign for both religions is that younger adults, particularly those aged 21 to 29, are less likely than older adults to identify as either Protestant or Catholic. This is partly because more young people identify as "other" or with other non-Christian religions, but mostly because of the large proportion -- 33% -- identifying with no religion.
| Protestant^ | Catholic | Other | None/Undesignated | |||||||||||||||||||||||||||||||||||||||||||||||||||||||||||||||||||||||||||||||||||||||||||||||||
|---|---|---|---|---|---|---|---|---|---|---|---|---|---|---|---|---|---|---|---|---|---|---|---|---|---|---|---|---|---|---|---|---|---|---|---|---|---|---|---|---|---|---|---|---|---|---|---|---|---|---|---|---|---|---|---|---|---|---|---|---|---|---|---|---|---|---|---|---|---|---|---|---|---|---|---|---|---|---|---|---|---|---|---|---|---|---|---|---|---|---|---|---|---|---|---|---|---|---|---|---|
| % | % | % | % | |||||||||||||||||||||||||||||||||||||||||||||||||||||||||||||||||||||||||||||||||||||||||||||||||
| U.S. total | ||||||||||||||||||||||||||||||||||||||||||||||||||||||||||||||||||||||||||||||||||||||||||||||||||||
| 2014-2017 | 47 | 22 | 11 | 20 | ||||||||||||||||||||||||||||||||||||||||||||||||||||||||||||||||||||||||||||||||||||||||||||||||
| 1955 | 71 | 24 | 4 | 1 | ||||||||||||||||||||||||||||||||||||||||||||||||||||||||||||||||||||||||||||||||||||||||||||||||
| Age: 21-29 | ||||||||||||||||||||||||||||||||||||||||||||||||||||||||||||||||||||||||||||||||||||||||||||||||||||
| 2014-2017 | 33 | 19 | 14 | 33 | ||||||||||||||||||||||||||||||||||||||||||||||||||||||||||||||||||||||||||||||||||||||||||||||||
| 1955 | 66 | 29 | 4 | 1 | ||||||||||||||||||||||||||||||||||||||||||||||||||||||||||||||||||||||||||||||||||||||||||||||||
| Age: 30-39 | ||||||||||||||||||||||||||||||||||||||||||||||||||||||||||||||||||||||||||||||||||||||||||||||||||||
| 2014-2017 | 40 | 20 | 11 | 28 | ||||||||||||||||||||||||||||||||||||||||||||||||||||||||||||||||||||||||||||||||||||||||||||||||
| 1955 | 68 | 27 | 4 | 1 | ||||||||||||||||||||||||||||||||||||||||||||||||||||||||||||||||||||||||||||||||||||||||||||||||
| Age: 40-49 | ||||||||||||||||||||||||||||||||||||||||||||||||||||||||||||||||||||||||||||||||||||||||||||||||||||
| 2014-2017 | 44 | 25 | 13 | 18 | ||||||||||||||||||||||||||||||||||||||||||||||||||||||||||||||||||||||||||||||||||||||||||||||||
| 1955 | 69 | 25 | 5 | 1 | ||||||||||||||||||||||||||||||||||||||||||||||||||||||||||||||||||||||||||||||||||||||||||||||||
| Age: 50-59 | ||||||||||||||||||||||||||||||||||||||||||||||||||||||||||||||||||||||||||||||||||||||||||||||||||||
| 2014-2017 | 53 | 23 | 7 | 17 | ||||||||||||||||||||||||||||||||||||||||||||||||||||||||||||||||||||||||||||||||||||||||||||||||
| 1955 | 75 | 19 | 4 | 2 | ||||||||||||||||||||||||||||||||||||||||||||||||||||||||||||||||||||||||||||||||||||||||||||||||
| Age: 60+ | ||||||||||||||||||||||||||||||||||||||||||||||||||||||||||||||||||||||||||||||||||||||||||||||||||||
| 2014-2017 | 55 | 23 | 9 | 12 | ||||||||||||||||||||||||||||||||||||||||||||||||||||||||||||||||||||||||||||||||||||||||||||||||
| 1955 | 78 | 16 | 4 | 2 | ||||||||||||||||||||||||||||||||||||||||||||||||||||||||||||||||||||||||||||||||||||||||||||||||
| ^Protestants for 2014-2017 are defined as Protestants + Christians (nonspecific) | ||||||||||||||||||||||||||||||||||||||||||||||||||||||||||||||||||||||||||||||||||||||||||||||||||||
| Gallup | ||||||||||||||||||||||||||||||||||||||||||||||||||||||||||||||||||||||||||||||||||||||||||||||||||||
Although the percentages saying they have attended church in the past seven days are relatively low, it should be noted that majorities of self-identified Protestants and Catholics of most ages are still active churchgoers. This is seen in responses to a separate question in which majorities say they attend once a month, nearly weekly or weekly. The only exception is Catholics aged 21 to 29; the majority of these say they seldom or never attend.
| 21-29 | 30-39 | 40-49 | 50-59 | 60+ | ||||||||||||||||||||||||||||||||||||||||||||||||||||||||||||||||||||||||||||||||||||||||||||||||
|---|---|---|---|---|---|---|---|---|---|---|---|---|---|---|---|---|---|---|---|---|---|---|---|---|---|---|---|---|---|---|---|---|---|---|---|---|---|---|---|---|---|---|---|---|---|---|---|---|---|---|---|---|---|---|---|---|---|---|---|---|---|---|---|---|---|---|---|---|---|---|---|---|---|---|---|---|---|---|---|---|---|---|---|---|---|---|---|---|---|---|---|---|---|---|---|---|---|---|---|---|
| % | % | % | % | % | ||||||||||||||||||||||||||||||||||||||||||||||||||||||||||||||||||||||||||||||||||||||||||||||||
| Protestants | ||||||||||||||||||||||||||||||||||||||||||||||||||||||||||||||||||||||||||||||||||||||||||||||||||||
| Once a week | 25 | 27 | 32 | 29 | 36 | |||||||||||||||||||||||||||||||||||||||||||||||||||||||||||||||||||||||||||||||||||||||||||||||
| Almost every week | 16 | 22 | 15 | 16 | 17 | |||||||||||||||||||||||||||||||||||||||||||||||||||||||||||||||||||||||||||||||||||||||||||||||
| Once a month | 14 | 17 | 18 | 16 | 11 | |||||||||||||||||||||||||||||||||||||||||||||||||||||||||||||||||||||||||||||||||||||||||||||||
| Seldom | 35 | 30 | 26 | 29 | 25 | |||||||||||||||||||||||||||||||||||||||||||||||||||||||||||||||||||||||||||||||||||||||||||||||
| Never | 11 | 4 | 9 | 9 | 10 | |||||||||||||||||||||||||||||||||||||||||||||||||||||||||||||||||||||||||||||||||||||||||||||||
| Catholics | ||||||||||||||||||||||||||||||||||||||||||||||||||||||||||||||||||||||||||||||||||||||||||||||||||||
| Once a week | 12 | 34 | 24 | 20 | 39 | |||||||||||||||||||||||||||||||||||||||||||||||||||||||||||||||||||||||||||||||||||||||||||||||
| Almost every week | 7 | 13 | 13 | 13 | 10 | |||||||||||||||||||||||||||||||||||||||||||||||||||||||||||||||||||||||||||||||||||||||||||||||
| Once a month | 25 | 16 | 20 | 19 | 18 | |||||||||||||||||||||||||||||||||||||||||||||||||||||||||||||||||||||||||||||||||||||||||||||||
| Seldom | 44 | 30 | 33 | 34 | 23 | |||||||||||||||||||||||||||||||||||||||||||||||||||||||||||||||||||||||||||||||||||||||||||||||
| Never | 11 | 8 | 8 | 14 | 8 | |||||||||||||||||||||||||||||||||||||||||||||||||||||||||||||||||||||||||||||||||||||||||||||||
| Note: Based on combined 2014-2017 data; Protestants defined as Protestants + Christians (nonspecific) | ||||||||||||||||||||||||||||||||||||||||||||||||||||||||||||||||||||||||||||||||||||||||||||||||||||
| Gallup | ||||||||||||||||||||||||||||||||||||||||||||||||||||||||||||||||||||||||||||||||||||||||||||||||||||
Bottom Line
After stabilizing in the mid-2000s, weekly church attendance among U.S. Catholics has resumed its downward trajectory over the past decade. In particular, older Catholics have become less likely to report attending church in the past seven days -- so that now, for the first time, a majority of Catholics in no generational group attend weekly. Further, given that young Catholics are even less devout, it appears the decline in church attendance will only continue. One advantage the Catholic Church has is that the overall proportion of Americans identifying as Catholic is holding fairly steady. However, that too may not last given the dwindling Catholic percentage among younger generations.
Protestant church seats may also be less full, but for a different reason. Although weekly attendance among Protestants has been stable, the proportion of adults identifying as Protestants has shrunk considerably over the past half-century. And that trend will continue as older Americans are replaced by a far less Protestant-identifying younger generation.
All of this comes amid a broader trend of more Americans opting out of formal religion or being raised without it altogether. In 2016, Gallup found one in five Americans professing no religious identity, up from as little as 2% just over 60 years ago.
Survey Methods
These results are based on aggregates of nationally representative standalone Gallup surveys for the following years: 1955, 1965-1966, 1975, 1983-1986, 1995-1996, 2005-2008 and 2014-2017. The sample sizes of Protestants for these periods range from 2,649 to 11,656. The sample sizes of Catholics range from 1,188 to 4,295.
| 1955 | 1965-1966 | 1975 | 1983-1986 | 1995-1996 | 2005-2008 | 2014-2017 | |||||||||||||||||||||||||||||||||||||||||||||||||||||||||||||||||||||||||||||||||||||||||||||
|---|---|---|---|---|---|---|---|---|---|---|---|---|---|---|---|---|---|---|---|---|---|---|---|---|---|---|---|---|---|---|---|---|---|---|---|---|---|---|---|---|---|---|---|---|---|---|---|---|---|---|---|---|---|---|---|---|---|---|---|---|---|---|---|---|---|---|---|---|---|---|---|---|---|---|---|---|---|---|---|---|---|---|---|---|---|---|---|---|---|---|---|---|---|---|---|---|---|---|---|
| % | % | % | % | % | % | % | |||||||||||||||||||||||||||||||||||||||||||||||||||||||||||||||||||||||||||||||||||||||||||||
| 21-29 | 73 | 56 | 35 | 37 | 25 | 29 | 25 | ||||||||||||||||||||||||||||||||||||||||||||||||||||||||||||||||||||||||||||||||||||||||||||
| 30-39 | 74 | 69 | 52 | 49 | 40 | 40 | 43 | ||||||||||||||||||||||||||||||||||||||||||||||||||||||||||||||||||||||||||||||||||||||||||||
| 40-49 | 76 | 70 | 57 | 48 | 52 | 44 | 40 | ||||||||||||||||||||||||||||||||||||||||||||||||||||||||||||||||||||||||||||||||||||||||||||
| 50-59 | 77 | 74 | 63 | 57 | 58 | 46 | 31 | ||||||||||||||||||||||||||||||||||||||||||||||||||||||||||||||||||||||||||||||||||||||||||||
| 60+ | 73 | 68 | 66 | 64 | 60 | 59 | 49 | ||||||||||||||||||||||||||||||||||||||||||||||||||||||||||||||||||||||||||||||||||||||||||||
| Gallup | |||||||||||||||||||||||||||||||||||||||||||||||||||||||||||||||||||||||||||||||||||||||||||||||||||
| 1955 | 1965-1966 | 1975 | 1983-1986 | 1995-1996 | 2005-2008 | 2014-2017 | |||||||||||||||||||||||||||||||||||||||||||||||||||||||||||||||||||||||||||||||||||||||||||||
|---|---|---|---|---|---|---|---|---|---|---|---|---|---|---|---|---|---|---|---|---|---|---|---|---|---|---|---|---|---|---|---|---|---|---|---|---|---|---|---|---|---|---|---|---|---|---|---|---|---|---|---|---|---|---|---|---|---|---|---|---|---|---|---|---|---|---|---|---|---|---|---|---|---|---|---|---|---|---|---|---|---|---|---|---|---|---|---|---|---|---|---|---|---|---|---|---|---|---|---|
| % | % | % | % | % | % | % | |||||||||||||||||||||||||||||||||||||||||||||||||||||||||||||||||||||||||||||||||||||||||||||
| 21-29 | 40 | 31 | 30 | 36 | 38 | 39 | 36 | ||||||||||||||||||||||||||||||||||||||||||||||||||||||||||||||||||||||||||||||||||||||||||||
| 30-39 | 42 | 37 | 40 | 38 | 39 | 48 | 46 | ||||||||||||||||||||||||||||||||||||||||||||||||||||||||||||||||||||||||||||||||||||||||||||
| 40-49 | 43 | 37 | 40 | 42 | 43 | 46 | 41 | ||||||||||||||||||||||||||||||||||||||||||||||||||||||||||||||||||||||||||||||||||||||||||||
| 50-59 | 45 | 38 | 41 | 40 | 40 | 46 | 44 | ||||||||||||||||||||||||||||||||||||||||||||||||||||||||||||||||||||||||||||||||||||||||||||
| 60+ | 40 | 43 | 44 | 45 | 49 | 47 | 48 | ||||||||||||||||||||||||||||||||||||||||||||||||||||||||||||||||||||||||||||||||||||||||||||
| Note: Protestants for 2005-2008 and 2014-2017 are defined as Protestants + Christians (nonspecific) | |||||||||||||||||||||||||||||||||||||||||||||||||||||||||||||||||||||||||||||||||||||||||||||||||||
| Gallup | |||||||||||||||||||||||||||||||||||||||||||||||||||||||||||||||||||||||||||||||||||||||||||||||||||