Story Highlights
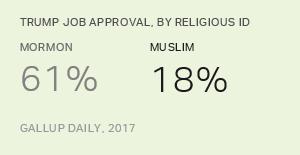
- 61% of Mormons approved of Trump in 2017
- Muslims' average approval was 18%; Jews' was 26%
- Catholics' approval of Trump was 38%, similar to the national average
WASHINGTON, D.C. -- President Donald Trump received well-above-average job approval ratings in 2017 from Mormons and Protestants, and well-below-average ratings from those who identify with a non-Christian faith, including Muslims and Jews, and from those who have no formal religious identity. Catholics' approval of Trump roughly matched the national average.
| Approve | |||||||||||||||||||||||||||||||||||||||||||||||||||||||||||||||||||||||||||||||||||||||||||||||||||
|---|---|---|---|---|---|---|---|---|---|---|---|---|---|---|---|---|---|---|---|---|---|---|---|---|---|---|---|---|---|---|---|---|---|---|---|---|---|---|---|---|---|---|---|---|---|---|---|---|---|---|---|---|---|---|---|---|---|---|---|---|---|---|---|---|---|---|---|---|---|---|---|---|---|---|---|---|---|---|---|---|---|---|---|---|---|---|---|---|---|---|---|---|---|---|---|---|---|---|---|
| % | |||||||||||||||||||||||||||||||||||||||||||||||||||||||||||||||||||||||||||||||||||||||||||||||||||
| Mormon | 61 | ||||||||||||||||||||||||||||||||||||||||||||||||||||||||||||||||||||||||||||||||||||||||||||||||||
| Protestant/Other Christian | 48 | ||||||||||||||||||||||||||||||||||||||||||||||||||||||||||||||||||||||||||||||||||||||||||||||||||
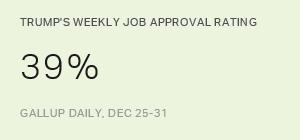
| National adults | 39 | ||||||||||||||||||||||||||||||||||||||||||||||||||||||||||||||||||||||||||||||||||||||||||||||||||
| Catholic | 38 | ||||||||||||||||||||||||||||||||||||||||||||||||||||||||||||||||||||||||||||||||||||||||||||||||||
| Jewish | 26 | ||||||||||||||||||||||||||||||||||||||||||||||||||||||||||||||||||||||||||||||||||||||||||||||||||
| None/Atheist/Agnostic | 23 | ||||||||||||||||||||||||||||||||||||||||||||||||||||||||||||||||||||||||||||||||||||||||||||||||||
| Other non-Christian religion | 22 | ||||||||||||||||||||||||||||||||||||||||||||||||||||||||||||||||||||||||||||||||||||||||||||||||||
| Muslim | 18 | ||||||||||||||||||||||||||||||||||||||||||||||||||||||||||||||||||||||||||||||||||||||||||||||||||
| GALLUP DAILY, 2017 | |||||||||||||||||||||||||||||||||||||||||||||||||||||||||||||||||||||||||||||||||||||||||||||||||||
These results are based on more than 122,000 interviews conducted as part of Gallup Daily tracking in 2017, with sample sizes ranging from 60,411 Protestants to 893 Muslims.
The pattern of Trump's job approval rating among religious groups reflects the general structure of religion and politics in the U.S. today rather than anything particularly unusual about the Trump presidency. In recent decades, Protestants and Mormons have typically been more likely to identify as Republicans and to approve of Republican presidents -- and to disapprove of Democratic presidents. Catholics have typically been similar to the overall national population in their political views, as they were for Trump in 2017. Those who identify with non-Christian religions and those who have no religious identity at all are typically less likely to identify as Republican and less likely to approve of a Republican president.
Data on Americans' images of Trump and Hillary Clinton during the 2016 presidential campaign reflected this same underlying pattern of differences across religious groups. And Gallup's analysis of Barack Obama's job approval ratings across religious groups showed the same patterns in reverse -- with Muslims the most positive about Obama and Mormons the least positive.
Also, the rank order of approval by religious group for Trump is similar to what it was for George W. Bush in 2008, the last year prior to 2017 that a Republican president occupied the White House.
Whites Drive Protestants' High Approval of Trump
Protestants are among the most likely religious groups to approve of Trump, and are the largest religious group in the U.S., encompassing 48% of the adult population. The broad "Protestant" category includes all Christians who do not identify as Catholic or Mormon, and almost half of this group approved of Trump's job performance during 2017 -- nine percentage points above his overall average.
The Protestant category is a "big tent," and more specifically includes three groups with differing political orientations -- white Protestants, black Protestants and Hispanic Protestants. Trump's above-average approval rating among Protestants is being driven by white Protestants, six in 10 of whom approve of the job Trump is doing, essentially the same as Mormons. In sharp contrast, only 10% of black Protestants approve, with the 28% approval among Hispanic Protestants well below the national average.
| Approve | |||||||||||||||||||||||||||||||||||||||||||||||||||||||||||||||||||||||||||||||||||||||||||||||||||
|---|---|---|---|---|---|---|---|---|---|---|---|---|---|---|---|---|---|---|---|---|---|---|---|---|---|---|---|---|---|---|---|---|---|---|---|---|---|---|---|---|---|---|---|---|---|---|---|---|---|---|---|---|---|---|---|---|---|---|---|---|---|---|---|---|---|---|---|---|---|---|---|---|---|---|---|---|---|---|---|---|---|---|---|---|---|---|---|---|---|---|---|---|---|---|---|---|---|---|---|
| % | |||||||||||||||||||||||||||||||||||||||||||||||||||||||||||||||||||||||||||||||||||||||||||||||||||
| White, non-Hispanic Protestants (70% of all Protestants) | 60 | ||||||||||||||||||||||||||||||||||||||||||||||||||||||||||||||||||||||||||||||||||||||||||||||||||
| Hispanic Protestants (9%) | 28 | ||||||||||||||||||||||||||||||||||||||||||||||||||||||||||||||||||||||||||||||||||||||||||||||||||
| Black, non-Hispanic Protestants (18%) | 10 | ||||||||||||||||||||||||||||||||||||||||||||||||||||||||||||||||||||||||||||||||||||||||||||||||||
| GALLUP DAILY, 2017 | |||||||||||||||||||||||||||||||||||||||||||||||||||||||||||||||||||||||||||||||||||||||||||||||||||
Hispanic Catholics Much Less Positive About Trump than White Catholics
American Catholics -- about 23% of the overall adult population -- give Trump an approval rating that is about at the national average. Similarly, Catholics' political party identification matches the national pattern almost identically.
Exit poll data from the 2016 election suggested that despite this underlying parity, Catholics tilted slightly toward Trump over Clinton in their vote, while Clinton won the overall national popular vote.
Part of the reason for the Catholic vote tilting toward Trump may be the differences in turnout among white and Hispanic Catholics -- and the fact that these two groups of Catholics differ substantially in their views of the president. About 33% of U.S. Catholic adults are Hispanic, and only 17% of these approve of the job Trump is doing as president. Non-Hispanic white Catholics, in turn, give Trump a 51% job approval rating, well above the national average.
| Approve | |||||||||||||||||||||||||||||||||||||||||||||||||||||||||||||||||||||||||||||||||||||||||||||||||||
|---|---|---|---|---|---|---|---|---|---|---|---|---|---|---|---|---|---|---|---|---|---|---|---|---|---|---|---|---|---|---|---|---|---|---|---|---|---|---|---|---|---|---|---|---|---|---|---|---|---|---|---|---|---|---|---|---|---|---|---|---|---|---|---|---|---|---|---|---|---|---|---|---|---|---|---|---|---|---|---|---|---|---|---|---|---|---|---|---|---|---|---|---|---|---|---|---|---|---|---|
| % | |||||||||||||||||||||||||||||||||||||||||||||||||||||||||||||||||||||||||||||||||||||||||||||||||||
| White Catholics | 51 | ||||||||||||||||||||||||||||||||||||||||||||||||||||||||||||||||||||||||||||||||||||||||||||||||||
| Hispanic Catholics | 17 | ||||||||||||||||||||||||||||||||||||||||||||||||||||||||||||||||||||||||||||||||||||||||||||||||||
| GALLUP DAILY, 2017 | |||||||||||||||||||||||||||||||||||||||||||||||||||||||||||||||||||||||||||||||||||||||||||||||||||
Hispanic Catholics also have a significantly lower job approval rating of Trump than do Hispanic Protestants.
Jews' Approval of Trump Remains Low
American Jews' 28% approval rating for Trump is significantly below the national average. This reflects the strong underlying connection between Jews and the Democratic Party; in 2017, 65% of Jews identified with or leaned toward the Democratic Party, 20 points above the national average. And exit poll data showed that 71% of Jews voted for Clinton in 2016, compared with 23% who voted for Trump.
Trump has adopted a pro-Israel position in his presidency so far, evidenced particularly by his announcement last year that the U.S. would move its embassy in Israel from Tel Aviv to Jerusalem. But the historical record suggests it's unlikely that any of this will make a significant difference in how Jews in the U.S. view his presidency.
Bottom Line
Views of Trump vary widely across religious groups in the U.S. today, but this reflects the stable underlying structure of religion and politics, rather than new patterns specific to Trump's presidency. Trump may continue to make efforts to target and reach out to specific religious groups, but the evidence shows that it will be difficult to bring about a fundamental change in how those who identify with various religions view a Republican president.
Explore President Trump's approval ratings and compare them with those of past presidents in the Gallup Presidential Job Approval Center.
Survey Methods
Results for this Gallup poll are based on telephone interviews conducted Jan. 2-Dec. 30, 2017, on the Gallup U.S. Daily survey, with a random sample of 122,322 adults, aged 18 and older, living in all 50 U.S. states and the District of Columbia. For results based on the total sample of national adults, the margin of sampling error is ±1 percentage points at the 95% confidence level. The sample sizes and margin of sampling error for specific religious groups are in the accompanying table. The margin of sampling error varies for each of these subgroups. All reported margins of sampling error include computed design effects for weighting.
Each sample of national adults includes a minimum quota of 70% cellphone respondents and 30% landline respondents, with additional minimum quotas by time zone within region. Landline and cellular telephone numbers are selected using random-digit-dial methods.
Learn more about how the Gallup U.S. Daily works.
| Sample size | Margin of sampling error | ||||||||||||||||||||||||||||||||||||||||||||||||||||||||||||||||||||||||||||||||||||||||||||||||||
|---|---|---|---|---|---|---|---|---|---|---|---|---|---|---|---|---|---|---|---|---|---|---|---|---|---|---|---|---|---|---|---|---|---|---|---|---|---|---|---|---|---|---|---|---|---|---|---|---|---|---|---|---|---|---|---|---|---|---|---|---|---|---|---|---|---|---|---|---|---|---|---|---|---|---|---|---|---|---|---|---|---|---|---|---|---|---|---|---|---|---|---|---|---|---|---|---|---|---|---|
| pct. pts. | |||||||||||||||||||||||||||||||||||||||||||||||||||||||||||||||||||||||||||||||||||||||||||||||||||
| Protestant | 60,411 | ±1 | |||||||||||||||||||||||||||||||||||||||||||||||||||||||||||||||||||||||||||||||||||||||||||||||||
| Catholic | 26,819 | ±1 | |||||||||||||||||||||||||||||||||||||||||||||||||||||||||||||||||||||||||||||||||||||||||||||||||
| No formal religion | 21,430 | ±1 | |||||||||||||||||||||||||||||||||||||||||||||||||||||||||||||||||||||||||||||||||||||||||||||||||
| Other non-Christian religion | 3,645 | ±2 | |||||||||||||||||||||||||||||||||||||||||||||||||||||||||||||||||||||||||||||||||||||||||||||||||
| Jewish | 3,081 | ±2 | |||||||||||||||||||||||||||||||||||||||||||||||||||||||||||||||||||||||||||||||||||||||||||||||||
| Mormon | 2,241 | ±3 | |||||||||||||||||||||||||||||||||||||||||||||||||||||||||||||||||||||||||||||||||||||||||||||||||
| Muslim | 893 | ±4 | |||||||||||||||||||||||||||||||||||||||||||||||||||||||||||||||||||||||||||||||||||||||||||||||||
| Gallup Daily, 2017 | |||||||||||||||||||||||||||||||||||||||||||||||||||||||||||||||||||||||||||||||||||||||||||||||||||