GALLUP NEWS SERVICE
PRINCETON, NJ -- Gallup's annual survey on Values and Beliefs, conducted May 8-11, 2006, finds that the vast majority of Americans continue to support "right-to-die" laws for terminally ill patients, whether that involves a doctor ending a patient's life by some painless means, or a doctor assisting a terminally ill patient to commit suicide. An analysis of Gallup data collected since 2003 shows that senior citizens, American who frequently attend religious services, those with lower levels of education, blacks, conservatives, and Republicans are most likely to object to euthanasia and doctor-assisted suicide.
Overall Results
The May poll asked two different questions to gauge opinions for the issue of doctor-assisted suicide.
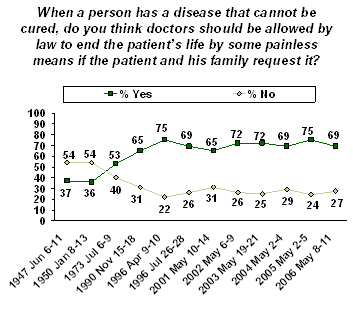
Half of the respondents in the survey were asked this long-term Gallup trend question on euthanasia:
- "When a person has a disease that cannot be cured, do you think doctors should be allowed by law to end the patient's life by some painless means if the patient and his family request it?"
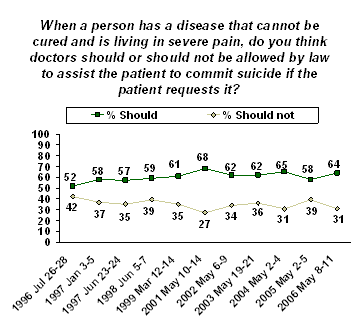
The other half of the respondents were asked this question that specifically mentions "suicide":
- "When a person has a disease that cannot be cured and is living in severe pain, do you think doctors should or should not be allowed by law to assist the patient to commit suicide if the patient requests it?"
Both questions find that more than 6 in 10 Americans support the notion of euthanasia or doctor-assisted suicide.
The longer-term trend question, asked since the 1940s, specifies that the doctor would be ending the terminally ill patient's life by some painless means. In 1947 and again in 1950, one-third of Americans said they supported euthanasia. This increased to 53% by 1973, and then from 1990 through the most recent survey, support has been much higher, fluctuating between 65% and 75%. The latest update shows a slight drop in support for euthanasia -- from 75% to 69% -- following the death of Terri Schiavo in 2005.

Gallup has only asked the second question -- which focuses on a doctor assisting the terminally ill patient to commit suicide at the patient's request -- since 1996. At that time, roughly half of Americans (52%) supported the notion of doctor-assisted suicide. From 1997 through 1999, during the time when Doctor Jack Kevorkian was making headlines for assisting over 130 patients with committing suicide, roughly 6 in 10 Americans showed support for this. Support then reached its highpoint at 68% in 2001 before declining to the low- to mid-60% range from 2002 through 2004. In 2005, support declined to 58% before rebounding this year to 64%.

Support by Subgroups
Since a majority of Americans have consistently shown support on these two measures, Gallup combined the results of its 2003-2006 surveys to get a better understanding of which groups Americans are most likely to support doctor-assisted suicide and euthanasia.
|
Group Support for Euthanasia/Doctor-Assisted Suicide |
||
|
Support doctor |
Support doctor |
|
|
% |
% |
|
|
Total sample |
69 |
58 |
|
|
|
|
|
Gender |
|
|
|
Men |
73 |
57 |
|
Women |
65 |
58 |
|
|
|
|
|
Age |
|
|
|
18- to 29-year-olds |
69 |
56 |
|
30- to 49-year-olds |
72 |
63 |
|
50- to 64-year-olds |
69 |
60 |
|
65 years and older |
62 |
47 |
|
|
|
|
|
Race |
|
|
|
Whites |
70 |
60 |
|
Blacks |
56 |
38 |
|
|
|
|
|
Education |
|
|
|
High school or less |
65 |
48 |
|
Some college |
69 |
60 |
|
College graduates |
76 |
70 |
|
Post-graduate education |
73 |
69 |
|
|
|
|
|
Religion |
|
|
|
Protestants |
61 |
50 |
|
Catholics |
71 |
62 |
|
No preference |
84 |
81 |
|
|
|
|
|
Church Attendance |
|
|
|
Weekly/almost weekly |
54 |
39 |
|
Monthly |
68 |
59 |
|
Seldom/never |
80 |
72 |
|
|
|
|
|
Party Affiliation |
|
|
|
Republicans |
63 |
50 |
|
Independents |
71 |
61 |
|
Democrats |
72 |
61 |
|
|
|
|
|
Political Ideology |
|
|
|
Conservatives |
57 |
44 |
|
Moderates |
74 |
65 |
|
Liberals |
82 |
70 |
The table illustrates several key points about support for end-of-life issues:
- Catholics are more likely than Protestants to support both euthanasia and doctor-assisted suicide; support is even higher on both measures for those with no religious affiliation.
- Church attendance also plays a role in shaping views on euthanasia and doctor-assisted suicide, with frequent church-goers much less likely than those who attend services less frequently to support both methods.
- Republicans show less support on these two questions than do independents or Democrats.
- The results to the two questions also differ by self-described political ideology, with conservatives much less likely to support euthanasia and doctor-assisted suicide than moderates or liberals.
- Blacks are less likely than whites to support both methods to end a terminally ill patient's life.
- Americans with a college degree or post-graduate education are more inclined than those with less education to show support on both measures.
- Americans aged 65 and older are less likely than those who are younger to support either euthanasia or doctor-assisted suicide.
- Men are more likely than women to support a doctor ending a patient's life by some painless means; there is essentially no difference in support between men and women for a doctor assisting a patient to commit suicide.
Survey Methods
Results are based on telephone interviews with 1,002 national adults, aged 18 and older, conducted May 8-11, 2006. For results based on the total sample of national adults, one can say with 95% confidence that the margin of sampling error is ±3 percentage points.
For results based on the 515 national adults in the Form A half-sample and 487 national adults in the Form B half-sample, the maximum margins of sampling error are ±5 percentage points.
In addition to sampling error, question wording and practical difficulties in conducting surveys can introduce error or bias into the findings of public opinion polls.