GALLUP NEWS SERVICE
PRINCETON, NJ -- Registered voters currently prefer the Democratic Party to the Republican Party by a 16-point margin for this year's midterm congressional elections; however, this is not necessarily a ringing endorsement of Democratic leadership. Other data from the same June 23-25 USA Today/Gallup survey suggest that Americans are discouraged with both parties in Congress and may simply be looking for a change.
At the very least, Americans are not highly familiar with the congressional leaders of either party and don't attach great import to which party is in power. While Republicans and Democrats tend to support their own parties on measures of congressional performance, independents are widely disaffected with both parties.
Congressional Leadership of Both Parties Gets a Thumbs Down
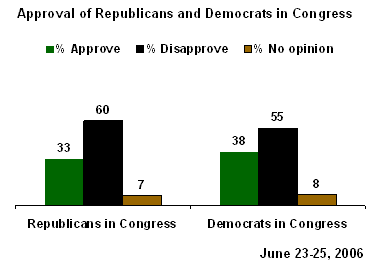
Only 38% of Americans approve of the job the Democrats in Congress are doing today, not materially greater than the 33% approving of the Republicans. More than half of Americans disapprove of each party's performance in Congress. In fact, the ratings for both parties are the worst Gallup has measured (in its periodic updating of this trend) since it began asking the question in 1999.
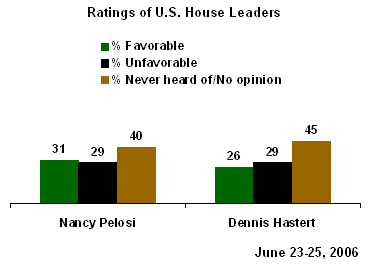
Americans give similar ratings to two of the more prominent congressional leaders of the parties -- Republican Speaker of the House Dennis Hastert and House Democratic Leader Nancy Pelosi, who is in line to succeed Hastert if Democrats win majority control of the House this fall. Pelosi is viewed favorably by 31% of Americans and unfavorably by 29%. Hastert's ratings are only slightly worse: 26% view him favorably and 29% unfavorably.
Despite the fact that Hastert has held his position since 1999 and Pelosi since 2002, at least 4 in 10 Americans have never heard of or have no opinion of either of these major congressional leaders.
Americans Unfazed by Majority Power
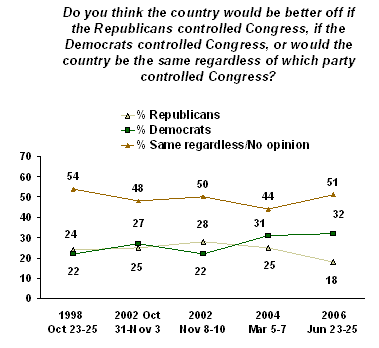
Although 54% of registered voters say they will vote for the Democratic candidate in their congressional district this fall (38% plan to vote for the Republican), only 32% of Americans say the country would be better off if the Democrats controlled Congress. This is nearly double the number saying the country would be better off with the Republicans in control (18%), but even more (51%) indicate it doesn't matter to them -- either saying the country would be the same regardless of which party is in control or saying they have no opinion.
To some extent, this cynicism about Congress is not new. On each of the five occasions when Gallup has asked this question since 1998, the plurality has said it doesn't matter which party controls Congress.
On a relative basis, however, the Democrats are clearly positioned better today on this measure than they were four or six years ago, when the Republicans were even with or ahead of the Democrats.
Independents Down on Both Parties
The overall findings that a majority of Americans disapprove of both parties in Congress, and think it doesn't matter which party is in control, mask some important underlying partisan patterns.
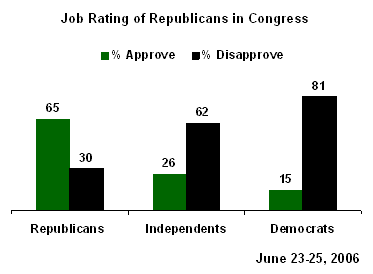
A majority of Republicans and Democrats support their own party's handling of its congressional responsibilities and denounce the other's. At the same time, a majority of independents are critical of both parties.
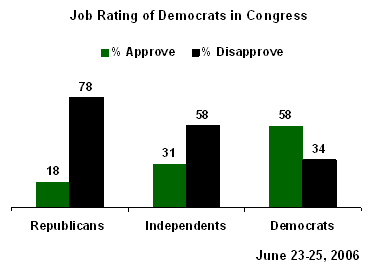
Similarly, each set of partisans think the country would be better off with their own party in control of Congress, while most independents think the party in control makes no difference.
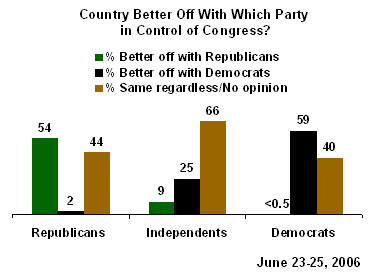
While partisans do back their own party on these questions, the percentages taking a pro-party position are not extraordinarily high. About a third of Republicans and Democrats disapprove of their own party's job performance in Congress. (By contrast, only 15% of Republicans disapprove of the job George W. Bush is doing as president.)
An even larger number from each party -- 40% or more -- say the country would be the same regardless of which party is in control.
All of this suggests that the Democrats' strong performance on the generic ballot today is more a reflection of public displeasure with the current Republican leadership than it is a positive endorsement of the Democrats.
Survey Methods
These results are based on telephone interviews with a randomly selected national sample of 1,000 adults, aged 18 and older, conducted June 23-25, 2006. For results based on this sample, one can say with 95% confidence that the maximum error attributable to sampling and other random effects is ±3 percentage points. In addition to sampling error, question wording and practical difficulties in conducting surveys can introduce error or bias into the findings of public opinion polls.
10. Next, we'd like to get your overall opinion of some people in the news. As I read each name, please say if you have a favorable or unfavorable opinion of these people -- or if you have never heard of them. How about -- [ITEM A READ FIRST, ITEMS B-I READ IN RANDOM ORDER, ITEM J READ LAST]?
F. House Democratic Leader, Nancy Pelosi
|
|
Favorable |
Unfavor- |
Never |
No |
|
% |
% |
% |
% |
|
|
2006 Jun 23-25 |
31% |
29 |
27 |
13 |
|
|
|
|
|
|
|
2003 Jul 25-27 |
23% |
19 |
42 |
16 |
|
2003 Jan 3-5 |
23% |
18 |
39 |
20 |
G. Speaker of the House, Dennis Hastert
|
|
Favorable |
Unfavor- |
Never |
No |
|
% |
% |
% |
% |
|
|
2006 Jun 23-25 |
26 |
29 |
27 |
18 |
|
|
|
|
|
|
|
2004 Jul 30-Aug 1 |
27 |
17 |
31 |
25 |
|
2003 Jul 25-27 |
28 |
12 |
41 |
19 |
|
2003 Jan 3-5 |
32 |
10 |
36 |
22 |
|
2002 Sep 23-26 |
30 |
11 |
31 |
28 |
|
2002 Jul 26-28 |
31 |
15 |
29 |
25 |
|
2001 Aug 3-5 |
29 |
15 |
36 |
20 |
|
2000 Oct 25-28 |
28 |
9 |
37 |
26 |
|
1999 Sep 10-14 |
23 |
7 |
22 |
48 |
|
1999 Feb 19-21 |
31 |
10 |
32 |
27 |
9. Do you approve or disapprove of the way [ROTATED] are handling their job?
A. The Republicans in Congress
|
|
Approve |
Disapprove |
No |
|
% |
% |
% |
|
|
2006 Jun 23-25 |
33 |
60 |
7 |
|
|
|
|
|
|
2005 Oct 21-23 |
38 |
58 |
4 |
|
2005 Apr 29-May 1 |
42 |
50 |
8 |
|
2003 Nov 14-16 |
48 |
49 |
3 |
|
2003 Oct 10-12 |
51 |
44 |
5 |
|
2002 Apr 5-7 |
59 |
30 |
11 |
|
2001 Aug 3-5 |
49 |
40 |
11 |
|
2001 Jun 8-10 |
49 |
43 |
8 |
|
2000 Aug 18-19 |
45 |
44 |
11 |
|
2000 Jul 25-26 |
46 |
39 |
15 |
|
2000 Apr 28-30 |
42 |
46 |
12 |
|
1999 Nov 4-7 |
38 |
53 |
9 |
|
1999 Oct 8-10 |
37 |
55 |
8 |
|
1999 Aug 16-18 |
36 |
53 |
11 |
|
1999 Jun 25-27 |
40 |
53 |
7 |
B. The Democrats in Congress
|
|
Approve |
Disapprove |
No |
|
% |
% |
% |
|
|
2006 Jun 23-25 |
38 |
55 |
8 |
|
|
|
|
|
|
2005 Oct 21-23 |
41 |
53 |
6 |
|
2005 Apr 29-May 1 |
40 |
52 |
8 |
|
2003 Nov 14-16 |
47 |
50 |
3 |
|
2003 Oct 10-12 |
45 |
48 |
7 |
|
2002 Apr 5-7 |
57 |
32 |
11 |
|
2001 Aug 3-5 |
52 |
38 |
10 |
|
2001 Jun 8-10 |
54 |
37 |
9 |
|
2000 Aug 18-19 |
56 |
34 |
10 |
|
2000 Jul 25-26 |
51 |
36 |
13 |
|
2000 Apr 28-30 |
46 |
42 |
12 |
|
1999 Nov 4-7 |
49 |
42 |
9 |
|
1999 Oct 8-10 |
48 |
44 |
8 |
|
1999 Aug 16-18 |
48 |
41 |
11 |
|
1999 Jun 25-27 |
46 |
46 |
8 |
11. Do you think the country would be better off if the Republicans controlled Congress, if the Democrats controlled Congress, or would the country be the same regardless of which party controlled Congress?
|
|
|
|
Same |
No |
|
% |
% |
% |
% |
|
|
2006 Jun 23-25 |
18 |
32 |
48 |
3 |
|
|
|
|
|
|
|
2004 Mar 5-7 |
25 |
31 |
39 |
5 |
|
2002 Nov 8-10 |
28 |
22 |
47 |
3 |
|
2002 Oct 31-Nov 3 |
25 |
27 |
42 |
6 |
|
1998 Oct 23-25 |
24 |
22 |
48 |
6 |