GALLUP NEWS SERVICE
PRINCETON, NJ -- Using its authority over interstate matters to address an issue usually left to the states, the U.S. Senate this week passed a bill that would make it a crime for anyone but the parents of a minor under 18 to transport her across state lines for an abortion without parental consent. If enacted, this would affect minors living in states both with and without parental consent laws on the books, but differences between the House and Senate bills still need to be resolved before it goes to President Bush for his signature.
This is likely to prove a politically safe vote for the 65 senators who backed the bill, as more than two-thirds of Americans say they favor laws requiring female minors to get parental consent for any abortion.
The bill was passed in an environment in which a majority of Americans think abortion should be legal in only a few circumstances or completely illegal, while fewer than half say abortion should be legal in all or most circumstances. At the same time, more Americans consider themselves pro-choice than pro-life in their abortion views, and only a minority of Americans favor a constitutional amendment banning abortion, such as the one recently adopted in South Dakota.
Steady Support for Consent Laws
According to a November 2005, Gallup Poll, 69% of Americans favor laws requiring women under 18 to obtain parental consent for any abortion; only 28% are opposed to this. Support has hovered around the 70% mark since opinion on the issue was first measured by Gallup in 1992.
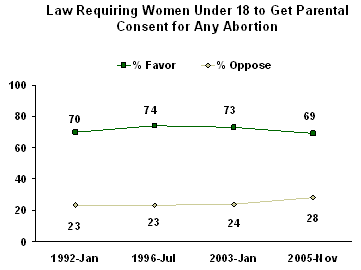
Although the bill passed by the Senate this week deals with preventing people from skirting state parental consent laws, these results suggest that support for such enforcement would be high.
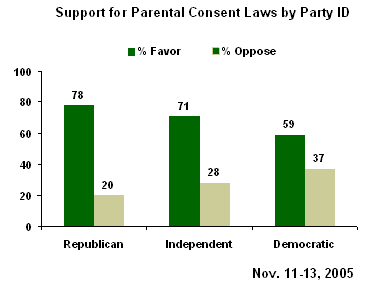
Support for parental consent is slightly higher among men than among women (74% vs. 65%). The policy is widely supported by Republicans and independents, but even a majority of Democrats favor it.
Younger Americans, aged 18 to 29, might be expected to have more sympathy for the freedom of minors to act without parental consent, but that is not the case. There is no difference by age group on this question, with 69% of those 18 to 29 favoring parental consent, compared with 71% of those 30 to 49 and 68% of those 50 and older.
Nearly as popular as the parental consent law, is the idea of a law requiring the husband of a married woman seeking an abortion to be notified. According to the November 2005, survey, 64% of Americans favor this while 34% are opposed.
Despite these high levels of support for restrictions on the ease with which women in certain circumstances can obtain an abortion, a broad constitutional amendment to ban all abortions except when necessary to save the life of the mother is not supported by a majority of Americans.
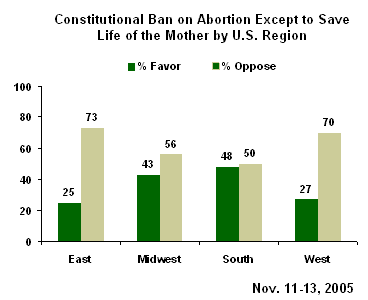
Nationally, only 37% of Americans favor this while 61% are opposed. However, in contrast to attitudes on parental consent and spousal notification, which are fairly uniform across the country, support for a constitutional ban varies widely by region. Support is highest in the South and Midwest where more than 4 in 10 adults favor it, but drops to about one-quarter of the public in the East and West.
A Possible Uptick in "Pro-Choice"
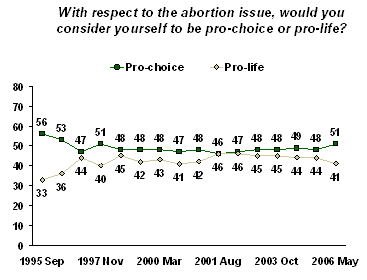
According to Gallup's annual Values and Beliefs survey, updated May 8-11, 2006, about half of Americans (51%) consider themselves pro-choice while 41% are pro-life. This is statistically no different from the May 2005, survey when 48% were pro-choice and 44% were pro-life. However, this is the first time since 1997 that Gallup has found a gap greater than six points on this measure. The latest 10-point difference is still lower than the 23-point gap found in 1995.
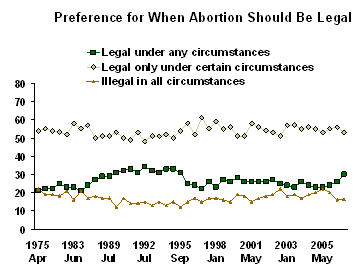
The May survey finds a similar shift -- small but noteworthy -- in the public's attitude about when abortion should be legal. For the past decade, the percentage of Americans saying abortion should be legal under any circumstances has averaged 25%, and never exceeded 28%. Today, 30% take this position, the highest level seen since 1995, but still a bit below the 34% found in 1992.
At the same time, there has been a slight decline in the percentage taking the most extreme anti-abortion position. The percentage saying abortion should be illegal in all circumstances is now 15%, down from an average of 18% recorded between 1996 and 2005, while the percentage taking the middle position -- saying abortion should be legal only under certain circumstances is 53%, similar to the average of 55%.
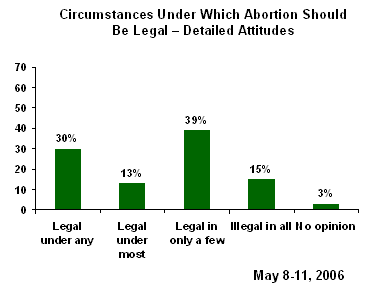
Since 1994, Gallup has posed a follow-up question to those taking the middle position, asking whether they think abortion should be legal in most circumstances or only in a few circumstances. The resulting array of opinions tilt toward favoring tight restrictions on abortion. Overall 43% of Americans say abortion should be legal under any circumstances or in most circumstances while 54% say it should be legal in only a few circumstances or illegal in all circumstances.
Also see related releases.
Survey Methods
The latest results are based on telephone interviews with a randomly selected national sample of 1,002 adults, aged 18 and older, conducted May 8-11, 2006. For results based on this sample, one can say with 95% confidence that the maximum error attributable to sampling and other random effects is ±3 percentage points. In addition to sampling error, question wording and practical difficulties in conducting surveys can introduce error or bias into the findings of public opinion polls.
13. Do you think abortions should be legal under any circumstances, legal only under certain circumstances, or illegal in all circumstances?
|
Legal |
Legal |
Illegal in all circumstances |
No opinion |
|
|
% |
% |
% |
% |
|
|
2006 May 8-11 |
30 |
53 |
15 |
2 |
|
2005 Nov 11-13 |
26 |
56 |
16 |
2 |
|
2005 Jun 24-26 |
24 |
55 |
20 |
1 |
|
2005 May 2-5 |
23 |
53 |
22 |
2 |
|
2005 Mar 21-23 |
23 |
55 |
20 |
2 |
|
2004 May 2-4 |
24 |
56 |
19 |
1 |
|
2003 Oct 24-26 |
26 |
55 |
17 |
2 |
|
2003 May 5-7 |
23 |
57 |
19 |
1 |
|
2003 Jan 10-12 |
24 |
57 |
18 |
1 |
|
2002 May 6-9 |
25 |
51 |
22 |
2 |
|
2002 Mar 22-24 |
27 |
53 |
19 |
1 |
|
2002 Feb 8-10 |
26 |
54 |
18 |
2 |
|
2001 Aug 10-12 |
26 |
56 |
17 |
1 |
|
2001 May 10-14 |
26 |
58 |
15 |
1 |
|
2001 Mar 26-28 |
26 |
51 |
18 |
5 |
|
2000 Mar 30-Apr 2 |
28 |
51 |
19 |
2 |
|
2000 Jan 13-16 |
26 |
56 |
15 |
3 |
|
1999 Apr 30-May 2 |
27 |
55 |
16 |
2 |
|
1998 Jan 16-18 |
23 |
59 |
17 |
1 |
|
1997 Nov 6-9 |
26 |
55 |
17 |
2 |
|
1997 Aug 12-13 |
22 |
61 |
15 |
2 |
|
1996 Sep 20-22 ^ |
24 |
52 |
17 |
7 |
|
1996 Jul 25-28 |
25 |
58 |
15 |
2 |
|
1995 Sep 22-24 |
31 |
54 |
12 |
3 |
|
1995 Feb 24-26 |
33 |
50 |
15 |
2 |
|
1994 Sep 6-7 |
33 |
52 |
13 |
2 |
|
1994 Mar 28-30 |
31 |
51 |
15 |
3 |
|
1993 Mar 12-14 |
32 |
51 |
13 |
4 |
|
1992 Jul 23-24 ^† |
34 |
48 |
15 |
3 |
|
1992 Jan 16-19 |
31 |
53 |
14 |
2 |
|
1991 Sep 5-8 |
33 |
49 |
14 |
4 |
|
1991 May 30-Jun 2 |
32 |
50 |
17 |
1 |
|
1990 Apr 5-20 |
31 |
53 |
12 |
4 |
|
1989 Jul 6-9 |
29 |
51 |
17 |
3 |
|
1989 Jul 6-7 |
29 |
51 |
17 |
3 |
|
1989 Apr 12-13 † |
27 |
50 |
18 |
5 |
|
1988 Sep 25-Oct 1 |
24 |
57 |
17 |
2 |
|
1985 Jan 3-4 † |
21 |
55 |
21 |
3 |
|
1983 Jun 24-27 |
23 |
58 |
16 |
3 |
|
1981 May 8-11 |
23 |
52 |
21 |
4 |
|
1980 Jul 11-14 |
25 |
53 |
18 |
4 |
|
1979 Feb 23-26 |
22 |
54 |
19 |
5 |
|
1977 Dec 9-12 |
22 |
55 |
19 |
4 |
|
1975 Apr 4-7 |
21 |
54 |
22 |
3 |
|
^ Based on registered voters |
||||
|
† Gallup/Newsweek |
||||
14. (If certain circumstances) Do you think abortion should be legal in most circumstances or only in a few circumstances?
COMBINED RESPONSES (Q.13-14)
|
Legal |
Legal under most circumstances |
Legal only |
Illegal in all circumstances |
No opinion |
|
|
% |
% |
% |
% |
% |
|
|
2006 May 8-11 |
30 |
13 |
39 |
15 |
3 |
|
2005 Nov 11-13 |
26 |
16 |
39 |
16 |
3 |
|
2005 Jun 24-26 |
24 |
15 |
40 |
20 |
1 |
|
2005 May 2-5 |
23 |
12 |
40 |
22 |
3 |
|
2005 Mar 21-23 |
23 |
14 |
39 |
20 |
4 |
|
2004 May 2-4 |
24 |
13 |
42 |
19 |
2 |
|
2003 Oct 24-26 |
26 |
14 |
40 |
17 |
3 |
|
2003 May 5-7 |
23 |
15 |
42 |
19 |
1 |
|
2003 Jan 10-12 |
24 |
14 |
42 |
18 |
2 |
|
2002 May 6-9 |
25 |
12 |
39 |
22 |
2 |
|
2002 Mar 22-24 |
27 |
12 |
40 |
19 |
2 |
|
2001 Aug 10-12 |
26 |
12 |
43 |
17 |
2 |
|
2001 May 10-14 |
26 |
15 |
41 |
15 |
3 |
|
2001 Mar 26-28 |
26 |
13 |
38 |
18 |
5 |
|
2000 Mar 30-Apr 2 |
28 |
11 |
38 |
19 |
4 |
|
2000 Jan 13-16 |
26 |
17 |
39 |
15 |
3 |
|
1999 Apr 30-May 2 |
27 |
12 |
42 |
16 |
3 |
|
1998 Jan 16-18 |
23 |
16 |
42 |
17 |
2 |
|
1997 Nov 6-9 |
26 |
15 |
40 |
17 |
2 |
|
1997 Aug 12-13 |
22 |
12 |
48 |
15 |
3 |
|
1996 Jul 25-28 |
25 |
13 |
43 |
15 |
4 |
|
1995 Sep 22-24 |
31 |
14 |
39 |
12 |
4 |
|
1995 Feb 24-26 |
32 |
9 |
41 |
15 |
3 |
|
1994 Sep 6-7 |
33 |
13 |
38 |
13 |
3 |
15. With respect to the abortion issue, would you consider yourself to be pro-choice or pro-life?
|
Pro-choice |
Pro-life |
MIXED/ |
DON'T KNOW |
No opinion |
|
|
% |
% |
% |
% |
% |
|
|
2006 May 8-11 |
51 |
41 |
4 |
2 |
3 |
|
2005 May 2-5 |
48 |
44 |
3 |
3 |
2 |
|
2004 May 2-4 |
49 |
44 |
2 |
3 |
2 |
|
2003 Oct 24-26 |
48 |
45 |
3 |
3 |
1 |
|
2003 May 5-7 |
48 |
45 |
2 |
4 |
1 |
|
2002 May 6-9 |
47 |
46 |
3 |
3 |
1 |
|
2001 Aug 10-12 |
46 |
46 |
3 |
3 |
2 |
|
2001 May 10-14 |
48 |
42 |
4 |
4 |
2 |
|
2001 Mar 26-28 |
47 |
41 |
4 |
6 |
2 |
|
2000 Mar 30-Apr 2 |
48 |
43 |
2 |
4 |
3 |
|
1999 Apr 30-May 2 |
48 |
42 |
3 |
4 |
3 |
|
1998 Jan 16-18 |
48 |
45 |
3 |
2 |
2 |
|
1997 Nov 6-9 |
51 |
40 |
3 |
3 |
3 |
|
1997 Aug 12-13 |
47 |
44 |
3 |
3 |
3 |
|
1996 Jul 25-28 |
53 |
36 |
5 |
3 |
3 |
|
1995 Sep 22-24 |
56 |
33 |
5 |
3 |
3 |
|
(vol.) = Volunteered response |
|||||
|
NOTE: Trends taken only from polls where previous two questions (abortion legal under which circumstances) also asked. |
|||||
16. Would you like to see the Supreme Court overturn its 1973 Roe versus Wade decision concerning abortion, or not?
|
Yes, overturn |
No, not overturn |
No opinion |
|
|
% |
% |
% |
|
|
2006 May 8-11 |
32 |
55 |
13 |
|
2006 Jan 20-22 |
25 |
66 |
9 |
|
2005 Jul 7-10 ^ |
28 |
63 |
9 |
|
^ Asked of a half sample |
|||
Trends for Comparison: The 1973 Roe versus Wade decision established a woman's constitutional right to an abortion, at least in the first three months of pregnancy. Would you like to see the Supreme Court COMPLETELY OVERTURN its Roe versus Wade decision, or not?
|
Yes, overturn |
No, not overturn |
No opinion |
|
|
% |
% |
% |
|
|
2005 Jul 7-10 ^ |
29 |
68 |
3 |
|
2002 Mar 22-24 |
36 |
60 |
4 |
|
1992 Aug 13-14 |
34 |
60 |
6 |
|
1989 Oct 5-8 |
33 |
61 |
6 |
|
1989 Jul 6-7 |
31 |
58 |
11 |
|
^ Asked of a half sample |
|||
17. Next, do you favor or oppose each of the following proposals. How about -- [ITEMS A-B ROTATED, ITEM C READ LAST]
|
2005 Nov 11-13, (sorted by "favor") |
Favor |
Oppose |
|
% |
% |
|
|
A law requiring women under 18 to get parental consent for any abortion |
69 |
28 |
|
A law requiring that the husband of a married woman be notified if she decides to have an abortion |
64 |
34 |
|
A constitutional amendment to ban abortion in all circumstances, except when necessary to save the life of the mother |
37 |
61 |
Full Trends: Abortion Proposals
A. A law requiring women under 18 to get parental consent for any abortion
|
Favor |
Oppose |
No opinion |
|
|
% |
% |
% |
|
|
2005 Nov 11-13 |
69 |
28 |
3 |
|
2003 Jan 10-12 |
73 |
24 |
3 |
|
1996 Jul 25-28 |
74 |
23 |
3 |
|
1992 Jan 16-19 |
70 |
23 |
7 |
B. A law requiring that the husband of a married woman be notified if she decides to have an abortion
|
Favor |
Oppose |
No opinion |
|
|
% |
% |
% |
|
|
2005 Nov 11-13 |
64 |
34 |
2 |
|
2003 Jan 10-12 |
72 |
26 |
2 |
|
1996 Jul 25-28 |
70 |
26 |
4 |
|
1992 Jan 16-19 |
73 |
25 |
2 |
C. A constitutional amendment to ban abortion in all circumstances, except when necessary to save the life of the mother
|
Favor |
Oppose |
No opinion |
|
|
% |
% |
% |
|
|
2005 Nov 11-13 |
37 |
61 |
2 |
|
2003 Jan 10-12 |
38 |
59 |
3 |
|
1996 Jul 25-28 |
38 |
59 |
3 |
|
1992 Jan 16-19 |
42 |
56 |
2 |
|
1984 |
50 |
46 |
4 |
