These data and analysis focus on four key measures that Gallup has tracked over the years in midterm elections. This history provides a framework for forecasting the results of this year’s election. The four measures are: congressional generic ballot, presidential job approval, congressional job approval, and satisfaction with the way things are going in the country.
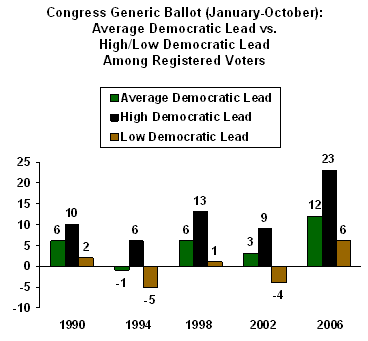
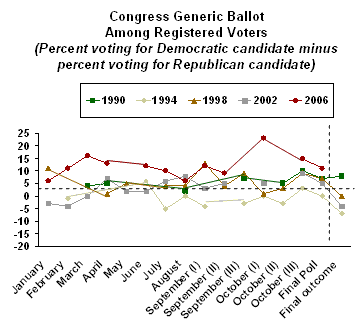
Democratic Lead in the Congressional
Generic Ballot
(Percent voting for Democratic candidate minus percent for
Republican candidate)
Among Registered Voters
|
|
Election |
Net change in Dem. seats |
Jan. |
Feb. |
Mar. |
Apr. |
May |
Jun. |
Jul. |
Aug. |
Sep. (1) |
Sep. (2) |
Sep. (3) |
Oct. (1) |
Oct. (2) |
Oct. (3) |
Final Poll |
|
1974 |
59-41 D |
+43 |
26 |
32 |
28 |
25 |
28 |
26 |
|||||||||
|
1978 |
55-46 D |
-11 |
26 |
24 |
22 |
24 |
19 |
24 |
24 |
24 |
25 |
17 |
|||||
|
1982 |
56-44 D |
+26 |
11 |
20 |
16 |
17 |
14 |
18 |
17 |
18 |
|||||||
|
1986 |
-- |
+5 |
10 |
0 |
13 |
1 |
8 |
||||||||||
|
1990 |
54-46 D |
+9 |
4 |
5 |
2 |
7 |
5 |
10 |
7 |
||||||||
|
1994 |
54-47 R |
-53 |
-1 |
6 |
-5 |
0 |
-4 |
-3 |
0 |
-3 |
3 |
0 |
|||||
|
1998 |
50-50 R |
+5 |
11 |
1 |
5 |
4 |
4 |
13 |
4 |
9 |
1 |
3 |
9 |
7 |
|||
|
2002 |
52-48 R |
-3 |
-3 |
-4 |
0 |
7 |
2 |
2 |
6 |
8 |
3 |
5 |
5 |
9 |
5 |
||
|
2006 |
-- |
-- |
6 |
11 |
16 |
13 |
12 |
10 |
6 |
12 |
9 |
23 |
15 |
11 |
Democratic Lead in the Congressional
Generic Ballot
(Percent voting for Democratic candidate minus percent for
Republican candidate)
Among Likely Voters
|
|
Election |
Net change in Dem. seats |
Jan. |
Feb. |
Mar. |
Apr. |
May |
Jun. |
Jul. |
Aug. |
Sep. (1) |
Sep. (2) |
Sep. (3) |
Oct. (1) |
Oct. (2) |
Oct. (3) |
Final Poll |
|
1974 |
59-41 D |
+43 |
18 |
||||||||||||||
|
1978 |
55-46 D |
-11 |
10 |
||||||||||||||
|
1982 |
56-44 D |
+26 |
10 |
||||||||||||||
|
1986 |
-- |
+5 |
|||||||||||||||
|
1990 |
54-46 D |
+9 |
8 |
||||||||||||||
|
1994 |
54-47 R |
-53 |
-12 |
-10 |
-7 |
||||||||||||
|
1998 |
50-50 R |
+5 |
-6 |
0 |
-4 |
1 |
1 |
6 |
1 |
-2 |
4 |
0 |
|||||
|
2002 |
52-48 R |
-3 |
4 |
1 |
3 |
-6 |
|||||||||||
|
2006 |
-- |
-- |
0 |
23 |
13 |
7 |
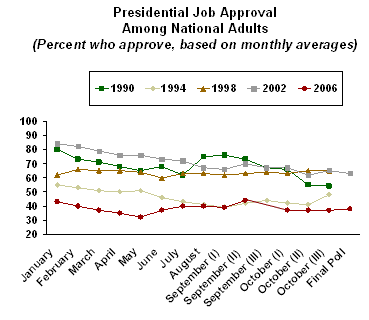
Presidential Job Approval
(Percent saying approve)
Among National Adults
|
|
Election |
Net change in Dem. seats |
Jan. |
Feb. |
Mar. |
Apr. |
May |
Jun. |
Jul. |
Aug. |
Sep. (1) |
Sep. (2) |
Sep. (3) |
Oct. (1) |
Oct. (2) |
Oct. (3) |
Final Poll |
|
1974 |
59-41 D |
+43 |
27 |
27 |
26 |
26 |
26 |
27 |
24 |
48 |
66 |
50 |
53 |
||||
|
1978 |
55-46 D |
-11 |
54 |
49 |
49 |
41 |
42 |
43 |
40 |
41 |
42 |
45 |
48 |
49 |
|||
|
1982 |
56-44 D |
+26 |
48 |
47 |
46 |
44 |
45 |
45 |
42 |
42 |
42 |
42 |
|||||
|
1986 |
-- |
+5 |
64 |
63 |
62 |
68 |
63 |
63 |
61 |
62 |
63 |
||||||
|
1990 |
54-46 D |
+9 |
80 |
73 |
71 |
68 |
65 |
68 |
62 |
75 |
76 |
73 |
67 |
66 |
55 |
54 |
|
|
1994 |
54-47 R |
-53 |
55 |
53 |
51 |
50 |
51 |
46 |
43 |
41 |
39 |
42 |
44 |
42 |
41 |
48 |
|
|
1998 |
50-50 R |
+5 |
62 |
66 |
65 |
65 |
64 |
60 |
63 |
63 |
62 |
63 |
64 |
63 |
65 |
65 |
|
|
2002 |
52-48 R |
-3 |
84 |
82 |
79 |
76 |
76 |
73 |
72 |
67 |
66 |
70 |
67 |
67 |
62 |
67 |
63 |
|
2006 |
-- |
-- |
43 |
40 |
37 |
35 |
32 |
37 |
40 |
40 |
39 |
44 |
37 |
37 |
37 |
38 |
|
NOTE: August 1974 presidential approval results represent the average of Richard Nixon's final approval rating (24%) and Gerald Ford's first approval rating (71%). |
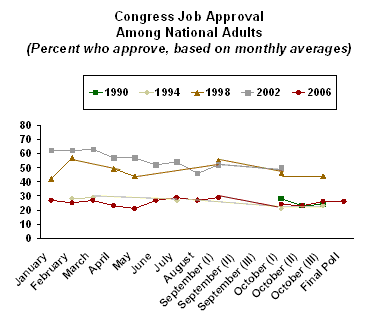
Congressional Job Approval
(Percent saying approve)
Among National Adults
|
|
Election |
Net change in Dem. seats |
Jan. |
Feb. |
Mar. |
Apr. |
May |
Jun. |
Jul. |
Aug. |
Sep. (1) |
Sep. (2) |
Sep. (3) |
Oct. (1) |
Oct. (2) |
Oct. (3) |
Final Poll |
|
1974 |
59-41 D |
+43 |
30 |
47 |
35 |
||||||||||||
|
1978 |
55-46 D |
-11 |
29 |
||||||||||||||
|
1982 |
56-44 D |
+26 |
29 |
||||||||||||||
|
1986 |
-- |
+5 |
42 |
||||||||||||||
|
1990 |
54-46 D |
+9 |
28 |
23 |
24 |
||||||||||||
|
1994 |
54-47 R |
-53 |
28 |
29 |
27 |
21 |
23 |
||||||||||
|
1998 |
50-50 R |
+5 |
42 |
57 |
49 |
44 |
55 |
46 |
44 |
||||||||
|
2002 |
52-48 R |
-3 |
62 |
62 |
63 |
57 |
57 |
52 |
54 |
46 |
52 |
50 |
|||||
|
2006 |
-- |
-- |
27 |
25 |
27 |
23 |
21 |
27 |
29 |
27 |
29 |
24 |
23 |
26 |
26 |
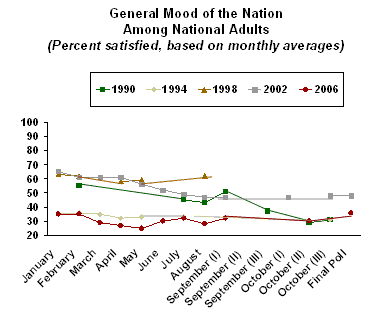
General Mood of the Nation
(Percent saying satisfied with the way things are going)
Among National Adults
|
|
Election |
Net change in Dem. seats |
Jan. |
Feb. |
Mar. |
Apr. |
May |
Jun. |
Jul. |
Aug. |
Sep. (1) |
Sep. (2) |
Sep. (3) |
Oct. (1) |
Oct. (2) |
Oct. (3) |
Final Poll |
|
1974 |
59-41 D |
+43 |
|||||||||||||||
|
1978 |
55-46 D |
-11 |
|||||||||||||||
|
1982 |
56-44 D |
+26 |
25 |
24 |
|||||||||||||
|
1986 |
-- |
+5 |
66 |
69 |
58 |
||||||||||||
|
1990 |
54-46 D |
+9 |
55 |
45 |
43 |
51 |
37 |
29 |
31 |
||||||||
|
1994 |
54-47 R |
-53 |
35 |
36 |
35 |
32 |
33 |
33 |
31 |
||||||||
|
1998 |
50-50 R |
+5 |
63 |
62 |
58 |
59 |
62 |
||||||||||
|
2002 |
52-48 R |
-3 |
65 |
61 |
61 |
61 |
56 |
52 |
49 |
47 |
47 |
47 |
48 |
||||
|
2006 |
-- |
-- |
35 |
35 |
29 |
27 |
25 |
30 |
32 |
28 |
32 |
30 |
35 |