GALLUP NEWS SERVICE
PRINCETON, NJ -- With the image of Congress in the doldrums and the Republican Party already 12 points behind the Democrats in favorability with the public, the email scandal involving former Republican House Representative Mark Foley comes at a vulnerable time for the GOP. The best that can be said about the Republican Party's vital signs is that they are slightly improved since this past spring, but they are still alarmingly weak for a party that hopes to win another term as the majority power in Congress.
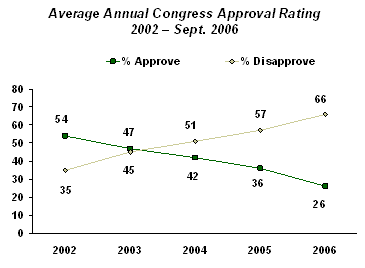
As of a month ago, Gallup's annual Governance survey found only 29% of Americans approved of the overall job Congress is doing; 63% disapproved. That level of approval was slightly higher than the 21% and 23% approval rating this spring, but close to the average approval score of 26% seen thus far in 2006.
Highlighting the difficulty the incumbent Republican majority faces in next month's midterm elections, the 2006 average approval rating for Congress is well below the range of approval seen since the previous midterm elections in 2002.
This general pall over Congress is also reflected in Gallup's annual Confidence in Institutions rating, last updated in June 2006. Of 15 institutions rated, Congress ranks #13 with only 19% of Americans expressing high confidence. The top rated institution, the military, garners 73% high confidence.
Republicans' Favorability Deficit
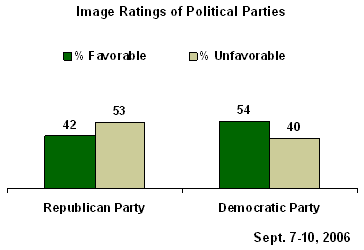
Even before the Foley scandal, the Republican Party was facing image problems with the public. According to Gallup's Sept. 7-10, 2006 Governance survey, a majority of Americans held a mostly unfavorable view of the Republican Party (53% unfavorable vs. 42% favorable) while the Democrats' image was mostly positive (54% favorable vs. 40% unfavorable).
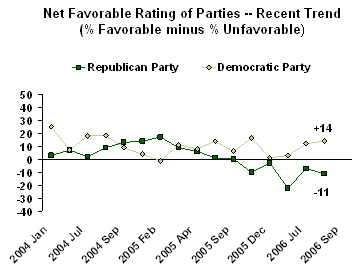
Republicans have been in red or neutral territory on this measure for about a year and a half. The last time a plurality or majority of Americans had a favorable view of the party was in February 2005. By contrast, the Democrats' image has been more positive than negative across this entire period.
Negligence or Corruption?
Republican House Speaker Dennis Hastert is now under fire for what the Washington Times calls "gross negligence" in his handling of the Foley matter, and what Democratic leader Nancy Pelosi terms a "cover-up." Hastert admits he learned late last year about personal email messages sent by former Representative Foley to a 16-year-old male page, but insists he had no idea of the possibly explicit nature of other emails authored by Foley until this past Friday.
Whether Americans view this as bureaucratic fumbling or political malfeasance on the part of Hastert and the Republican leadership could be pivotal in determining whether the Republicans maintain their majority control of Congress.
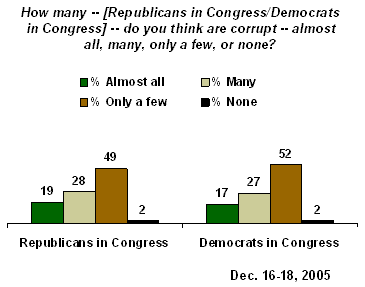
Prior to now, Americans have not made much distinction between the two major parties on the general corruption issue. According to a December 2005 Gallup survey, there is virtually no difference in Americans' estimates of the number of members of each party in Congress who are corrupt. About four in ten (44%) said they believed almost all or many Democratic members of Congress are corrupt, and 47% said the same of the Republicans in Congress.
More recently, a May 2006 survey found the vast majority (75%) of Americans perceive that the recent series of government corruption scandals in Washington involved both parties about equally. However, 15% said these scandals mostly involved Republicans while even fewer (5%) pinpointed the Democrats, giving the Democrats a slight upper hand on the issue.
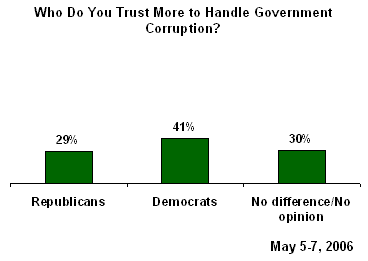
Additionally, by a 12-point margin, 41% vs. 29%, more Americans polled in May 2006 chose the Democratic party as the party better able to deal with corruption in government. But with 30% unable to differentiate, neither party was preferred on this issue by a majority of Americans.
Possibly a Defining Moment for Hastert
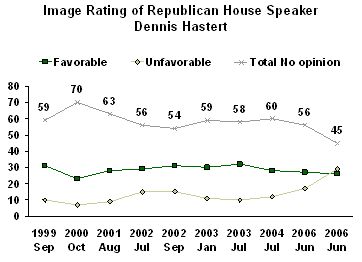
Despite the fact that Hastert has been House Speaker since 1999, he risks being publicly defined for the first time by the Foley page scandal. For most of Hastert's tenure, a majority of Americans have either never heard of Hastert or expressed no opinion of him. This finally changed in a June 2006 survey when Gallup found the total with no opinion dipping to 45%. Still, barely half of Americans had an opinion of Hastert, including 26% viewing him favorably and 29% unfavorably.
Survey Methods
The latest results are based on telephone interviews with a randomly selected national sample of 1,002 adults, aged 18 and older, conducted Sept. 7-10, 2006. For results based on this sample, one can say with 95% confidence that the maximum error attributable to sampling and other random effects is ±3 percentage points. In addition to sampling error, question wording and practical difficulties in conducting surveys can introduce error or bias into the findings of public opinion polls.
3. Do you approve or disapprove of the way Congress is handling its job?
|
|
Dis- |
No |
|
|
2006 |
% |
% |
% |
|
2006 Sep 7-10 |
29 |
63 |
8 |
|
|
|
|
|
|
2006 Aug 7-10 |
27 |
65 |
8 |
|
2006 Jul 6-9 |
29 |
61 |
10 |
|
2006 Jun 1-4 |
27 |
63 |
10 |
|
2006 May 8-11 |
21 |
71 |
8 |
|
2006 Apr 10-13 |
23 |
70 |
7 |
|
2006 Mar 13-16 |
27 |
65 |
8 |
|
2006 Feb 6-9 |
25 |
65 |
10 |
|
2006 Jan 9-12 |
27 |
67 |
7 |
|
2005 |
|
|
|
|
2005 Dec 5-8 |
29 |
63 |
8 |
|
2005 Nov 7-10 |
29 |
63 |
8 |
|
2005 Oct 13-16 |
29 |
64 |
7 |
|
2005 Sep 12-15 |
35 |
59 |
6 |
|
2005 Aug 8-11 |
36 |
58 |
6 |
|
2005 Jul 7-10 |
36 |
58 |
6 |
|
2005 Jun 6-8 |
34 |
59 |
7 |
|
2005 May 2-5 |
35 |
57 |
8 |
|
2005 Apr 4-7 |
38 |
54 |
8 |
|
2005 Mar 7-10 |
37 |
53 |
10 |
|
2005 Feb 7-10 |
45 |
48 |
7 |
|
2005 Jan 3-5 |
43 |
48 |
9 |
|
2004 |
|
|
|
|
2004 Dec 5-8 |
41 |
50 |
9 |
|
2004 Nov 7-10 |
41 |
52 |
7 |
|
2004 Oct 11-14 |
40 |
51 |
9 |
|
2004 Sep 13-15 |
41 |
52 |
7 |
|
2004 Aug 9-11 |
40 |
52 |
8 |
|
2004 Jul 8-11 |
40 |
53 |
7 |
|
2004 Jun 3-6 |
41 |
52 |
7 |
|
2004 May 2-4 |
41 |
52 |
7 |
|
2004 Apr 5-8 |
43 |
51 |
6 |
|
2004 Mar 8-11 |
42 |
51 |
7 |
|
2004 Feb 9-12 |
41 |
51 |
8 |
|
2004 Jan 12-15 |
48 |
45 |
7 |
|
2003 |
|
|
|
|
2003 Dec 11-14 |
43 |
50 |
7 |
|
2003 Nov 3-5 |
43 |
51 |
6 |
|
2003 Oct 6-8 |
41 |
51 |
8 |
|
2003 Sep 8-10 |
40 |
53 |
7 |
|
2003 Aug 4-6 |
45 |
46 |
9 |
|
2003 Jul 7-9 |
49 |
45 |
6 |
|
2003 Jun 12-15 |
50 |
41 |
9 |
|
2003 May 5-7 |
49 |
44 |
7 |
|
2003 Apr 7-9 |
58 |
33 |
9 |
|
2003 Mar 3-5 |
48 |
44 |
8 |
|
2003 Feb 3-6 |
50 |
39 |
11 |
|
2003 Jan 13-16 |
49 |
40 |
11 |
|
2002 |
|
|
|
|
2002 Dec 5-8 |
50 |
40 |
10 |
|
2002 Nov 11-14 |
47 |
39 |
14 |
|
2002 Oct 3-6 |
50 |
40 |
10 |
|
2002 Sep 5-8 |
52 |
40 |
8 |
|
2002 Aug 5-8 |
46 |
43 |
11 |
|
2002 Jul 26-28 |
53 |
36 |
11 |
|
2002 Jul 9-11 |
54 |
36 |
10 |
|
2002 Jun 3-6 |
52 |
38 |
10 |
|
2002 May 6-9 |
57 |
33 |
10 |
|
2002 Apr 8-11 |
57 |
34 |
9 |
|
2002 Mar 4-7 |
63 |
28 |
9 |
|
2002 Feb 4-6 |
62 |
28 |
10 |
|
2002 Jan 7-9 |
62 |
29 |
9 |
16. Next, please tell me whether you have a favorable or unfavorable opinion of each of the following parties. How about -- [ITEMS ROTATED]:
A. The Republican Party
|
Favorable |
Unfavorable |
No |
|
|
2006 |
% |
% |
% |
|
2006 Sep 7-10 |
42 |
53 |
4 |
|
|
|
|
|
|
2006 Jul 28-30 |
43 |
50 |
8 |
|
2006 Apr 28-30 |
36 |
58 |
5 |
|
2005 |
|
|
|
|
2005 Dec 16-18 |
45 |
48 |
7 |
|
2005 Oct 13-16 |
40 |
50 |
10 |
|
2005 Sep 8-11 |
45 |
45 |
10 |
|
2005 Jul 22-24 |
46 |
45 |
9 |
|
2005 Apr 1-2 |
50 |
44 |
6 |
|
2005 Feb 25-27 |
51 |
42 |
7 |
|
2005 Feb 4-6 |
56 |
39 |
5 |
|
2004 |
|
|
|
|
2004 Sep 13-15 |
55 |
41 |
4 |
|
2004 Sep 3-5 |
53 |
40 |
7 |
|
2004 Aug 23-25 ^ |
50 |
41 |
9 |
|
2004 Jul 30-Aug 1 |
47 |
45 |
8 |
|
2004 Jul 19-21 ^ |
50 |
43 |
7 |
|
2004 Jan 29-Feb 1 |
48 |
45 |
7 |
|
2004 Jan 2-5 |
52 |
40 |
8 |
|
2003 |
|
|
|
|
2003 Sep 8-10 |
50 |
44 |
6 |
|
2003 Mar 29-30 |
56 |
33 |
11 |
|
2003 Jan 3-5 |
51 |
38 |
11 |
|
2002 |
|
|
|
|
2002 Dec 16-17 |
51 |
38 |
11 |
|
2002 Nov 8-10 |
54 |
38 |
8 |
|
2002 Oct 21-22 |
53 |
35 |
12 |
|
2002 Sep 5-8 |
54 |
40 |
6 |
|
2002 Jul 26-28 |
55 |
36 |
9 |
|
2002 Jan 11-14 |
61 |
30 |
9 |
|
^ Asked of a half sample |
|||
|
† Based on registered voters |
|||
B. The Democratic Party
|
Favorable |
Unfavorable |
No |
|
|
2006 |
% |
% |
% |
|
2006 Sep 7-10 |
54 |
40 |
5 |
|
|
|
|
|
|
2006 Jul 28-30 |
52 |
40 |
8 |
|
2006 Apr 28-30 |
48 |
45 |
8 |
|
2005 |
|
|
|
|
2005 Dec 16-18 |
46 |
45 |
9 |
|
2005 Oct 13-16 |
52 |
36 |
12 |
|
2005 Sep 8-11 |
47 |
41 |
12 |
|
2005 Jul 22-24 |
52 |
38 |
10 |
|
2005 Apr 1-2 |
50 |
42 |
8 |
|
2005 Feb 25-27 |
52 |
41 |
7 |
|
2005 Feb 4-6 |
46 |
47 |
7 |
|
2004 |
|
|
|
|
2004 Sep 13-15 |
49 |
45 |
6 |
|
2004 Sep 3-5 |
50 |
41 |
9 |
|
2004 Aug 23-25 ^ |
54 |
36 |
10 |
|
2004 Jul 30-Aug 1 |
55 |
37 |
8 |
|
2004 Jul 19-21 ^ |
48 |
41 |
11 |
|
2004 Jan 29-Feb 1 |
59 |
34 |
7 |
|
2004 Jan 2-5 |
47 |
44 |
9 |
|
2003 |
|
|
|
|
2003 Sep 8-10 |
49 |
45 |
6 |
|
2003 Mar 29-30 |
49 |
39 |
12 |
|
2003 Jan 3-5 |
52 |
36 |
12 |
|
2002 |
|
|
|
|
2002 Dec 16-17 |
52 |
37 |
11 |
|
2002 Nov 8-10 |
48 |
42 |
10 |
|
2002 Oct 21-22 |
58 |
30 |
12 |
|
2002 Sep 5-8 |
56 |
38 |
6 |
|
2002 Jul 26-28 |
55 |
34 |
11 |
|
2002 Jan 11-14 |
55 |
33 |
12 |
|
^ Asked of a half sample |
|||
|
† Based on registered voters |
|||
10. Now I am going to read you a list of institutions in American society. Please tell me how much confidence you, yourself, have in each one -- a great deal, quite a lot, some, or very little? First, ... Next, [RANDOM ORDER]:
|
|
|
|
|
|
|
|
|
|
% |
% |
% |
% |
% |
% |
% |
|
|
The military |
41 |
32 |
19 |
5 |
1 |
1 |
73 |
|
The police |
25 |
33 |
29 |
10 |
2 |
1 |
58 |
|
The church or organized religion |
28 |
24 |
26 |
19 |
2 |
1 |
52 |
|
Banks |
18 |
31 |
39 |
10 |
* |
1 |
49 |
|
The U.S. Supreme Court |
14 |
26 |
41 |
15 |
1 |
3 |
40 |
|
The medical system |
14 |
24 |
36 |
22 |
2 |
1 |
38 |
|
The public schools |
15 |
22 |
36 |
23 |
2 |
2 |
37 |
|
The Presidency |
15 |
18 |
25 |
36 |
4 |
1 |
33 |
|
Television news |
12 |
19 |
40 |
25 |
3 |
1 |
31 |
|
Newspapers |
12 |
18 |
40 |
25 |
2 |
2 |
30 |
|
The criminal justice system |
9 |
16 |
43 |
28 |
3 |
1 |
25 |
|
Organized labor |
9 |
15 |
43 |
26 |
2 |
6 |
24 |
|
Congress |
5 |
14 |
44 |
32 |
3 |
2 |
19 |
|
Big business |
6 |
12 |
40 |
36 |
4 |
2 |
18 |
|
Health Maintenance Organizations, HMOs |
6 |
9 |
40 |
33 |
5 |
6 |
15 |
|
(vol.) Volunteered response |
|||||||
|
* Less than 0.5% |
|||||||