GALLUP NEWS SERVICE
PRINCETON, NJ -- Gallup's annual Values and Beliefs poll finds Americans are very pessimistic about the current state of moral values in the United States, as has typically been the case in recent years. Only about one in six Americans describe the state of moral values in the country in positive terms, and perceptions that moral values are "poor" in the country are at their highest point, edging closer to the 50% mark. More than 8 in 10 Americans think morality is getting worse, representing a slight increase in the past three years. The groups of Americans who are most negative about moral values in this country include senior citizens, blacks, women, conservative Republicans, Protestants, and weekly churchgoers.
Americans' Ratings of Moral Values in the United States
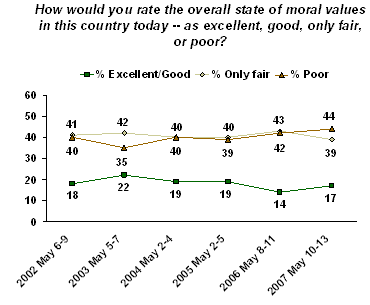
The May 10-13, 2007 poll finds that only about one in six Americans describe the state of moral values in the country today as excellent (1%) or good (16%), while 39% describe them as only fair and 44% as poor. Americans have consistently rated morality in non-positive terms since Gallup first asked this question in 2002. But, the percentage describing the nation's values as poor is at its highest point (albeit by two percentage points), and is edging closer to the 50% mark. The current 44% poor moral values rating is similar to the 42% measured last year, but these percentages are up from an average of 39% from polls conducted from 2002 through 2005.

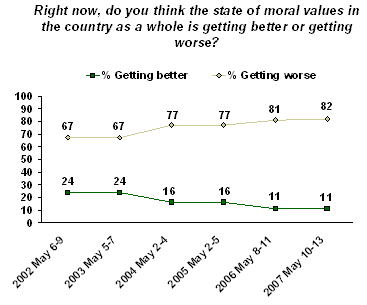
More than 8 in 10 Americans (82%) also say the state of moral values in the country as a whole is getting worse, while just 11% say it is getting better. These perceptions have consistently been negative, but have deteriorated over the past three years. In 2002 and 2003, perhaps as a result of the general rally effect that occurred in the aftermath of the 9/11 attacks, a relatively lower percentage, two in three Americans, said moral values were getting worse. This increased to 77% in both 2004 and 2005, before edging up over 80% in each of the last two years.

The combined results of these two questions create an overall view of Americans' perceptions of moral values in the country at this time, allowing for a three-category classification:
Positive: those who rate current conditions as excellent or good, and those who say conditions are getting better or staying the same.
Mixed: those who describe moral values as excellent or good right now, but think they are getting worse, or conversely, say moral values are only fair or poor but are getting better.
Negative: those who say morality in the country is only fair or poor right now, and that it is either remaining that way or getting worse.
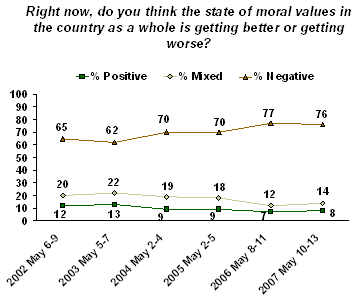
In all, just 8% of Americans fall into the positive category regarding their overall views of morality, with 14% having mixed views, and more than three in four (76%) having negative views of morality in the country. Americans' views of moral values, according to the combined results of the two questions, have also become more negative since 2002.

How Different Groups of Americans Perceive Moral Values in the U.S.
Since Americans' ratings of moral values have been quite stable (and negative) in recent years, Gallup combined the results of its past three May surveys, conducted in 2005 through 2007, to better examine which groups of Americans are relatively more or less negative about the state of morality in the country.
Americans in all key subgroups are pessimistic in their views of moral values in the U.S.
At the same time, there are certain groups of Americans who are particularly negative about morality: adults aged 65 and older, blacks, women, Republicans, self-described conservatives, conservative Republicans, Protestants, and those who attend church every week.
Young adults (ages 18 to 29), those residing in household earning $75,000 or more per year, adults with post graduate educations, and those with no religious preference tend to be slightly less negative about morality in the United States.
Here is a summary of the results:
|
Negative Perceptions of Morality in the U.S.
|
|||
|
Current conditions are poor |
Moral outlook getting worse |
Overall perceptions of moral values is negative |
|
|
% |
% |
% |
|
|
Total |
41 |
80 |
74 |
|
|
|
|
|
|
Men |
37 |
77 |
72 |
|
Women |
46 |
82 |
76 |
|
|
|
|
|
|
18-29 |
31 |
74 |
63 |
|
30-49 |
40 |
80 |
73 |
|
50-64 |
44 |
81 |
77 |
|
65 and older |
51 |
83 |
82 |
|
|
|
|
|
|
Whites |
40 |
79 |
73 |
|
Blacks |
48 |
85 |
81 |
|
|
|
|
|
|
Republicans |
45 |
84 |
78 |
|
Independents |
42 |
80 |
74 |
|
Democrats |
38 |
76 |
70 |
|
|
|
|
|
|
Conservatives |
49 |
86 |
81 |
|
Moderates |
39 |
79 |
74 |
|
Liberals |
32 |
71 |
61 |
|
|
|
|
|
|
Liberal Democrats |
32 |
69 |
62 |
|
Moderate Democrats |
37 |
77 |
73 |
|
Conservative Democrats |
51 |
88 |
81 |
|
Pure independents |
44 |
81 |
74 |
|
Liberal/Moderate Republicans |
39 |
82 |
72 |
|
Conservative Republicans |
48 |
84 |
81 |
|
|
|
|
|
|
Attend church weekly |
49 |
85 |
81 |
|
Attend church almost weekly/monthly |
41 |
80 |
74 |
|
Attend church seldom/never |
36 |
77 |
70 |
|
|
|
|
|
|
Protestants |
45 |
82 |
77 |
|
Catholics |
37 |
78 |
74 |
|
No religious preference |
35 |
76 |
66 |
|
|
|
|
|
|
Less than $30,000 annually |
47 |
83 |
77 |
|
$30,000-$74,999 annually |
42 |
81 |
76 |
|
$75,000 or more annually |
35 |
76 |
69 |
|
|
|
|
|
|
East |
39 |
80 |
73 |
|
Midwest |
41 |
80 |
74 |
|
South |
42 |
82 |
76 |
|
West |
43 |
77 |
73 |
|
|
|
|
|
|
High school education or less |
48 |
81 |
75 |
|
Some college |
43 |
82 |
77 |
|
College graduate |
36 |
77 |
72 |
|
Postgraduate education |
29 |
74 |
69 |
Survey Methods
Results are based on telephone interviews with 1,003 national adults, aged 18 and older, conducted May 10-13, 2007. For results based on the total sample of national adults, one can say with 95% confidence that the maximum margin of sampling error is ±3 percentage points. In addition to sampling error, question wording and practical difficulties in conducting surveys can introduce error or bias into the findings of public opinion polls.
How would you rate the overall state of moral values in this country today -- as excellent, good, only fair, or poor?
|
Excellent |
Good |
Only fair |
Poor |
No opinion |
|
|
% |
% |
% |
% |
% |
|
|
2007 May 10-13 |
1 |
16 |
39 |
44 |
1 |
|
2006 May 8-11 |
1 |
13 |
43 |
42 |
2 |
|
2005 May 2-5 |
2 |
17 |
40 |
39 |
2 |
|
2004 May 2-4 |
1 |
18 |
40 |
40 |
1 |
|
2003 May 5-7 |
2 |
20 |
42 |
35 |
1 |
|
2002 May 6-9 |
1 |
17 |
41 |
40 |
1 |
Right now, do you think the state of moral values in the country as a whole is getting better or getting worse?
|
Getting better |
Getting worse |
SAME
|
No
|
|
|
% |
% |
% |
% |
|
|
2007 May 10-13 |
11 |
82 |
4 |
2 |
|
2006 May 8-11 |
11 |
81 |
6 |
3 |
|
2005 May 2-5 |
16 |
77 |
5 |
2 |
|
2004 May 2-4 |
16 |
77 |
5 |
2 |
|
2003 May 5-7 |
24 |
67 |
7 |
2 |
|
2002 May 6-9 |
24 |
67 |
7 |
2 |
|
(vol.) = Volunteered response |
||||
MORAL VALUES OUTLOOK GROUPS
|
Positive |
Mixed |
Negative |
Undesignated |
|
|
% |
% |
% |
% |
|
|
2007 May 10-13 |
8 |
14 |
76 |
2 |
|
2006 May 8-11 |
7 |
12 |
77 |
4 |
|
2005 May 2-5 |
9 |
18 |
70 |
3 |
|
2004 May 2-4 |
9 |
19 |
70 |
2 |
|
2003 May 5-7 |
13 |
22 |
62 |
3 |
|
2002 May 6-9 |
12 |
20 |
65 |
3 |
