GALLUP NEWS SERVICE
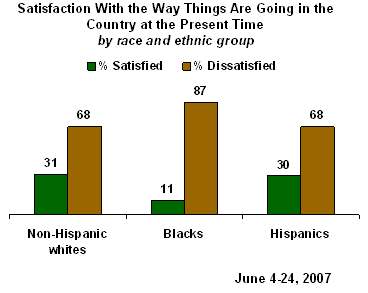
PRINCETON, NJ -- Gallup's annual Minority Rights and Relations poll finds only about 1 in 10 blacks saying they are satisfied with the way things are going in the country at the present time. Satisfaction with the state of the nation is also very low among Hispanics and whites, but not to the extent it is among blacks. National satisfaction among blacks, Hispanics, and whites, while not significantly different from last year, has never been lower in the seven-year history of this poll. Even though most whites, Hispanics, and blacks say they are at least somewhat satisfied with their personal lives, blacks are much less likely than whites or Hispanics to say they are "very satisfied." This has been the case each time Gallup has tracked this measure on this poll since 2001.
The poll was conducted June 4-24, 2007, interviewing 2,388 adults nationwide, including 868 non-Hispanic whites, 802 non-Hispanic blacks, and 502 Hispanics. The total sample is weighted to reflect the proper proportions of each group in the U.S. population. About one-quarter of the interviews with Hispanics were conducted in Spanish, with the remainder in English.
National Satisfaction
The poll asked Americans if they were generally satisfied or dissatisfied with "the way things are going in the United States at this time." Just about 3 in 10 whites (31%) and Hispanics (30%) say they are satisfied with the state of the nation right now; roughly two in three whites and Hispanics say they are dissatisfied. Only 11% of blacks are satisfied, while 87% are dissatisfied. Blacks have always expressed lower levels of satisfaction than whites or Hispanics.

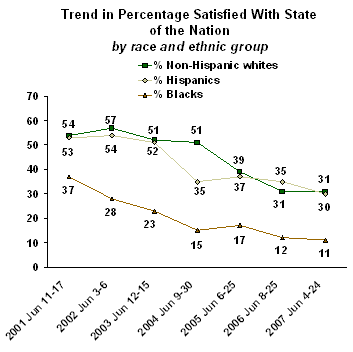
National satisfaction among whites, Hispanics, and blacks are now at their lowest levels in the seven years this survey has been conducted, although satisfaction has not changed significantly among any of these groups since last year's low ratings.
A majority of whites and Hispanics said they were satisfied with the state of the nation from 2001 through 2003. Hispanics' satisfaction dropped to the mid-30% range in 2004 and has remained at this low level ever since. Whites' satisfaction did not show a significant decline until 2005 when it was 39%, and then dropped again to 31% last year, where it remains today. Blacks' satisfaction was 37% in 2001, but it gradually declined until 2004, and has been below 20% since then.

Personal Satisfaction
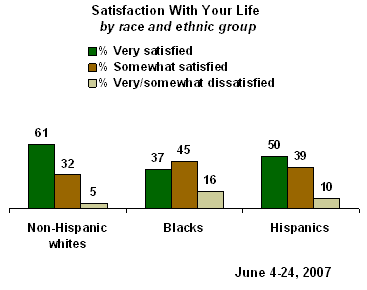
The poll also asked Americans if they are very satisfied, somewhat satisfied, somewhat dissatisfied, or very dissatisfied with their lives. When Gallup has asked the public this question on this survey and others, typically 9 in 10 Americans report being satisfied, including a majority who are "very satisfied."
At least 8 in 10 whites, Hispanics, and blacks tell Gallup that they are very or somewhat satisfied with their lives at the present time. This has been the case in each of the past six Minority Relations polls since 2001. However, whites are more likely than Hispanics or blacks to say they are "very satisfied" with their lives. Sixty-one percent of whites say they are very satisfied with their lives, compared with 50% of Hispanics and just 37% of blacks.

There have been some changes among these three groups in response to this question over the past six years:

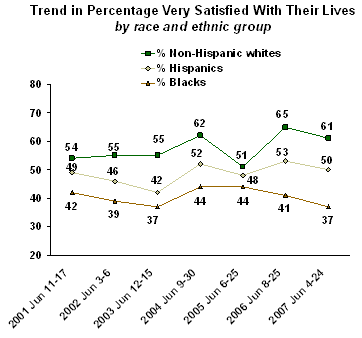
The percentage of whites who are very satisfied with their lives was in the mid-50% range from 2001 through 2003. This sentiment increased to 62% in 2004, before dropping to 51% in 2005. Since that time, at least 6 in 10 whites have said they are very satisfied with their personal lives.
Hispanics' satisfaction with their personal lives was 49% in 2001 and dropped to as low as 42% in 2003. Then, in 2004, the percentage of Hispanics who said they are very satisfied with their lives edged up to 52% and has not shown any significant change since then, ranging between 48% and 53% over the past three years.
Since 2001, blacks have consistently been less likely than whites or Hispanics to say they are very satisfied with their personal lives. But, over this time, the percentage saying this has not fluctuated that much -- at its high point in 2004 and 2005, 44% of blacks said they were very satisfied, and at its low point in 2003 and in the latest poll, 37% expressed this sentiment.
Survey Methods
Results are based on telephone interviews with 2,388 national adults, aged 18 and older, conducted June 4-24, 2007, including oversamples of blacks and Hispanics that are weighted to reflect their proportions in the general population. For results based on the total sample of national adults, one can say with 95% confidence that the maximum margin of sampling error is ±5 percentage points. For results based on sample of 868 non-Hispanic whites, the maximum margin of sampling error is ±7 percentage points. For results based on sample of 802 blacks, the maximum margin of sampling error is ±6 percentage points. For results based on sample of 502 Hispanics, the maximum margin of sampling error is ±6 percentage points. (138 out of the 502 interviews with Hispanics were conducted in Spanish). In addition to sampling error, question wording and practical difficulties in conducting surveys can introduce error or bias into the findings of public opinion polls.
2. In general, are you satisfied or dissatisfied with the way things are going in the United States at this time?
|
Satisfied |
Dissatisfied |
No opinion |
|
|
Non-Hispanic Whites |
% |
% |
% |
|
2007 Jun 4-24 |
31 |
68 |
1 |
|
2006 Jun 8-25 |
31 |
66 |
3 |
|
2005 Jun 6-25 |
39 |
58 |
3 |
|
2004 Jun 9-30 |
51 |
47 |
2 |
|
2003 Jun 12-15 |
52 |
47 |
1 |
|
2002 Jun 3-6 |
57 |
40 |
3 |
|
2001 Jun 11-17 |
54 |
43 |
3 |
|
Blacks |
|||
|
2007 Jun 4-24 |
11 |
87 |
2 |
|
2006 Jun 8-25 |
12 |
85 |
3 |
|
2005 Jun 6-25 |
17 |
80 |
3 |
|
2004 Jun 9-30 |
15 |
83 |
2 |
|
2003 Jun 12-18 |
23 |
74 |
3 |
|
2002 Jun 3-9 |
28 |
67 |
5 |
|
2001 Jun 11-17 |
37 |
60 |
3 |
|
Hispanics |
|||
|
2007 Jun 4-24 |
30 |
68 |
2 |
|
2006 Jun 8-25 |
35 |
61 |
3 |
|
2005 Jun 6-25 |
37 |
59 |
4 |
|
2004 Jun 9-30 |
35 |
60 |
5 |
|
2003 Jun 12-18 |
51 |
46 |
3 |
|
2002 Jun 3-9 |
54 |
43 |
3 |
|
2001 Jun 11-17 |
53 |
44 |
3 |
4. Overall, how satisfied are you with your life -- are you very satisfied, somewhat satisfied, somewhat dissatisfied, or very dissatisfied?
|
Very satisfied |
Somewhat satisfied |
Somewhat dissatisfied |
Very dissatisfied |
No
|
|
|
Non-Hispanic Whites |
% |
% |
% |
% |
% |
|
2007 Jun 4-24 |
61 |
32 |
3 |
2 |
1 |
|
2006 Jun 8-25 |
65 |
26 |
4 |
4 |
* |
|
2005 Jun 6-25 |
51 |
37 |
8 |
4 |
* |
|
2004 Jun 9-30 |
62 |
30 |
6 |
2 |
* |
|
2003 Jun 12-15 |
55 |
37 |
6 |
2 |
* |
|
2002 Jun 3-6 |
55 |
37 |
5 |
2 |
1 |
|
2001 Jun 11-17 |
54 |
38 |
5 |
3 |
* |
|
Blacks |
|||||
|
2007 Jun 4-24 |
37 |
45 |
9 |
7 |
2 |
|
2006 Jun 8-25 |
41 |
45 |
10 |
4 |
* |
|
2005 Jun 6-25 |
44 |
39 |
12 |
4 |
1 |
|
2004 Jun 9-30 |
44 |
38 |
10 |
6 |
2 |
|
2003 Jun 12-18 |
37 |
45 |
12 |
5 |
1 |
|
2002 Jun 3-9 |
39 |
45 |
11 |
4 |
1 |
|
2001 Jun 11-17 |
42 |
45 |
11 |
1 |
1 |
|
Hispanics |
|||||
|
2007 Jun 4-24 |
50 |
39 |
7 |
3 |
2 |
|
2006 Jun 8-25 |
53 |
36 |
7 |
2 |
2 |
|
2005 Jun 6-25 |
48 |
40 |
6 |
4 |
2 |
|
2004 Jun 9-30 |
52 |
34 |
8 |
3 |
3 |
|
2003 Jun 12-18 |
42 |
43 |
11 |
3 |
1 |
|
2002 Jun 3-9 |
46 |
44 |
6 |
2 |
2 |
|
2001 Jun 11-17 |
49 |
39 |
9 |
3 |
* |
|
* = Less than 0.5% |
|||||
