GALLUP NEWS SERVICE
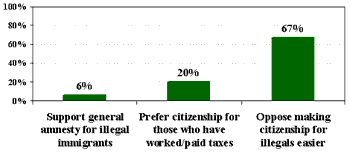
PRINCETON, NJ -- Mexican President Vicente Fox reportedly surprised his White House hosts at a welcoming ceremony Wednesday by forsaking the usual diplomatic bromides and launching into an intensive lobbying effort on behalf of amnesty for the estimated three million Mexican immigrants now living in the United States illegally. Gallup polling about blanket amnesty for illegal immigrants more generally finds the public widely unsympathetic to this proposal, with only 6% supporting it. An additional 20% think that citizenship should be granted selectively to illegal immigrant workers who have been here a specified length of time and paid taxes, but two-thirds of Americans think that the United States should not do anything to facilitate citizenship for illegal immigrants.
| Amnesty for Illegal Immigrants? |
 |
| Aug. 24-26, 2001 |
The public's opposition to blanket amnesty is not surprising given its longstanding position against expanding immigration to the United States. Most recently, in a Jun. 11-17 survey, Gallup found that only 14% of Americans think that immigration to the United States should be increased, while 41% think that it should be decreased and 42% think that it should remain as it is. This general pattern has remained constant for the four decades Gallup has asked this question, starting in 1965.
In your view, should immigration be kept at its present level, increased, or decreased?
|
|
Present level |
Increased |
Decreased |
No opinion |
|
% |
% |
% |
% |
|
|
2001 Jun 11-17 |
42 |
14 |
41 |
3 |
|
2001 Mar 26-28 |
41 |
10 |
43 |
6 |
|
2000 Sep 11-13 |
41 |
13 |
38 |
8 |
|
1999 Feb 26-28 |
41 |
10 |
44 |
5 |
|
1995 Jul 7-9 |
27 |
7 |
62 |
4 |
|
1995 Jun 5-6 |
24 |
7 |
65 |
4 |
|
1993 Jul 9-11 |
27 |
6 |
65 |
2 |
|
1986 Jun 19-23 |
35 |
7 |
49 |
9 |
|
1977 Mar 25-28 |
37 |
7 |
42 |
14 |
|
1965 Jun 24-29 |
39 |
7 |
33 |
20 |
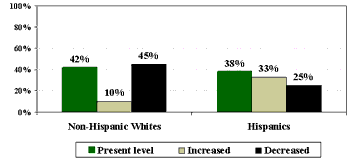
Opposition to increased immigration is high among non-Hispanic whites in America: A total of 87% of this group thinks that immigration should be either decreased or remain at its present level, while only 10% favor increased immigration. However, opposition is also fairly high among Hispanic Americans. Gallup's June survey found that only 33% of this group favors increased immigration, while 65% think that it should be reduced or maintained at current levels.
| Should Immigration Be Kept at its Present Level, Increased, or Decreased? |
 |
| Jun. 11-17, 2001 |
Americans Hold Muted Favorable Opinion of Mexico
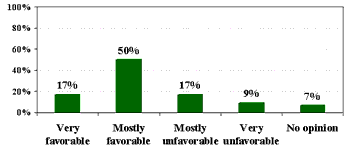
Perhaps compounding the problem Fox faces in the United States is the fact that Mexico has a fairly muted favorable image in the United States. Only 17% of Americans, according to a Gallup foreign policy poll conducted this February, have a "very favorable" view of Mexico. This contrasts with 51% who have a very favorable view of Canada, 43% of Australia, and 41% of Great Britain.
When factoring in those who feel "mostly favorable" about Mexico, the total percentage of Americans who have a favorable view of their Southern neighbor is much larger, 67%. However this is still substantially lower than the 85-90% who have an overall favorable view of the United States' three major English-speaking allies, and puts Mexico on par with Israel, Egypt, and Brazil.
| Opinion of Mexico |
 |
| Feb. 1-4, 2001 |
Political Costs Not Clear
Despite these attitudes that may hinder Mr. Fox's attempt to sway President Bush and Congress on the amnesty issue, it is not clear that the political costs involved in supporting his proposal are high. A January Gallup survey finds that the roughly 40% of Americans who favor a decrease in immigration -- presumably the group that would be most opposed to the blanket amnesty program -- are nevertheless not highly interested in seeing Congress take action on immigration this year, suggesting it is a low salience issue for them. Only 24% of this group said immigration is an "extremely important" issue for Congress to address. Education, the economy, health care, and Social Security emerged as much more pressing concerns for them -- as well as for the public at large -- with a third or more of Americans rating these as extremely important.
President Bush has already contradicted public attitudes on one Mexican-relations issue -- trucking -- with seemingly no negative political effect. A Gallup poll in early August found that 58% of Americans felt that if allowed to operate on U.S. highways, Mexican trucks would be less safe than U.S. owned and operated trucks. Nevertheless, Bush has indicated his support for giving Mexican "long-haul" trucks unlimited access to U.S. roads, citing its importance to the Mexican economy.
Survey Methods
These results are based on telephone interviews with randomly selected national samples of 1,000 or more adults, 18 years and older. Exact survey dates are shown in the accompanying tables. For results based on samples of this size, one can say with 95 percent confidence that the maximum error attributable to sampling and other random effects is plus or minus 3 percentage points. In addition to sampling error, question wording and practical difficulties in conducting surveys can introduce error or bias into the findings of public opinion polls.
Do you think the United States should or should not make it easier for illegal immigrants to become citizens of the United States?
|
|
Should |
Should not |
No opinion |
|
2001 Aug 24-26 |
28% |
67 |
5 |
Which of the following proposals would you prefer for illegal immigrants currently living in the United States -- [ROTATED: they should be granted general amnesty, (or) they should be allowed to stay in the United States only if they have worked and paid taxes for a certain length of time]?
COMBINED RESPONSES
|
2001 Aug 24-26 |
|
|
% |
|
|
Easier, prefer general amnesty |
6 |
|
Easier, prefer citizenship for those who have worked/paid taxes |
20 |
|
Easier, no preference |
2 |
|
Not easier |
67 |
|
No opinion |
5 |
In your view, should immigration be kept at its present level, increased, or decreased?
|
|
Present level |
Increased |
Decreased |
No opinion |
|
% |
% |
% |
% |
|
|
2001 Jun 11-17 |
||||
|
National Adults |
42 |
14 |
41 |
3 |
|
Men |
41 |
15 |
41 |
3 |
|
Women |
43 |
12 |
42 |
3 |
|
Non-Hispanic Whites |
42 |
10 |
45 |
3 |
|
Blacks |
42 |
24 |
31 |
3 |
|
Hispanics |
38 |
33 |
25 |
4 |
NATIONAL ADULT TREND
|
|
Present level |
Increased |
Decreased |
No opinion |
|
% |
% |
% |
% |
|
|
2001 Jun 11-17 |
42 |
14 |
41 |
3 |
|
2001 Mar 26-28 |
41 |
10 |
43 |
6 |
|
2000 Sep 11-13 |
41 |
13 |
38 |
8 |
|
1999 Feb 26-28 ^ |
41 |
10 |
44 |
5 |
|
1995 Jul 7-9 |
27 |
7 |
62 |
4 |
|
1995 Jun 5-6 |
24 |
7 |
65 |
4 |
|
1993 Jul 9-11 |
27 |
6 |
65 |
2 |
|
1986 Jun 19-23 † |
35 |
7 |
49 |
9 |
|
1977 Mar 25-28 |
37 |
7 |
42 |
14 |
|
1965 Jun 24-29 |
39 |
7 |
33 |
20 |
|
^ Based on 514 national adults; margin of error ± 5 PCT. PTS. |
||||
|
† CBS/NYT |
||||
Next, I'd like your overall opinion of some foreign countries. First, is your overall opinion of [RANDOM ORDER]very favorable, mostly favorable, mostly unfavorable, or very unfavorable? (How about …)
R. Mexico
|
Very favor- |
Mostly favor- |
Mostly unfavor- |
Very unfavor- |
No |
Total favor- |
Total unfavor- |
|
|
% |
% |
% |
% |
% |
% |
% |
|
|
2001 Feb 1-4 |
17 |
50 |
17 |
9 |
7 |
67 |
26 |
|
1999 Feb 8-9 |
12 |
43 |
26 |
8 |
11 |
55 |
34 |
|
1996 Mar 8-10 |
11 |
46 |
23 |
9 |
11 |
57 |
32 |
|
1993 Jun 29-30 |
7 |
36 |
35 |
14 |
8 |
43 |
49 |
|
1991 Mar 14-17 |
12 |
53 |
18 |
4 |
13 |
65 |
22 |
|
1989 Feb 28-Mar 2 |
7 |
55 |
21 |
6 |
11 |
62 |
27 |
BASED ON -- 494 -- NATIONAL ADULTS IN FORM A; ±5 PCT. PTS.
|
2001 Feb 1-4 |
Very favor- |
Mostly favor- |
Mostly unfavor- |
Very unfavor- |
No |
Total favor- |
Total unfavor- |
|
% |
% |
% |
% |
% |
% |
% |
|
|
Canada |
51 |
39 |
4 |
3 |
3 |
90 |
7 |
|
Australia |
43 |
42 |
4 |
4 |
7 |
85 |
8 |
|
Great Britain |
41 |
44 |
6 |
3 |
6 |
85 |
9 |
|
Italy |
24 |
54 |
8 |
4 |
10 |
78 |
12 |
|
France |
22 |
55 |
12 |
5 |
6 |
77 |
17 |
|
Germany |
20 |
55 |
9 |
7 |
9 |
75 |
16 |
|
Israel |
18 |
45 |
20 |
12 |
5 |
63 |
32 |
|
Japan |
17 |
56 |
14 |
7 |
6 |
73 |
21 |
|
Mexico |
17 |
50 |
17 |
9 |
7 |
67 |
26 |
|
Brazil |
13 |
56 |
12 |
5 |
14 |
69 |
17 |
|
The Philippines |
12 |
51 |
19 |
6 |
12 |
63 |
25 |
|
Egypt |
11 |
54 |
19 |
4 |
12 |
65 |
23 |
|
South Africa |
11 |
46 |
24 |
9 |
10 |
57 |
33 |
|
Taiwan |
11 |
52 |
14 |
8 |
15 |
63 |
22 |
|
India |
8 |
50 |
24 |
6 |
12 |
58 |
30 |
|
Colombia |
7 |
23 |
38 |
21 |
11 |
30 |
59 |
|
Saudi Arabia |
7 |
40 |
28 |
18 |
7 |
47 |
46 |
|
Vietnam |
7 |
39 |
30 |
14 |
10 |
46 |
44 |
|
Russia |
6 |
46 |
27 |
15 |
6 |
52 |
42 |
|
China |
5 |
40 |
31 |
17 |
7 |
45 |
48 |
|
Cuba |
4 |
23 |
41 |
27 |
5 |
27 |
68 |
|
The Palestine Authority |
4 |
18 |
39 |
24 |
15 |
22 |
63 |
|
North Korea |
3 |
28 |
37 |
22 |
10 |
31 |
59 |
|
Iran |
2 |
10 |
45 |
38 |
5 |
12 |
83 |
|
Iraq |
2 |
7 |
34 |
51 |
6 |
9 |
85 |
|
Libya |
2 |
9 |
40 |
35 |
14 |
11 |
75 |
Thinking for a moment about trucks that are owned and operated by Mexican companies. If Mexican trucks are driven on U.S. highways, would you say these trucks would be safer, less safe, or about as safe as trucks owned and operated by U.S. companies?
BASED ON -- 517 -- NATIONAL ADULTS IN FORM A; ± 5 PCT. PTS.
|
|
|
|
About as safe |
No |
|
2001 Aug 3-5 |
1% |
58 |
31 |
10 |
