GALLUP NEWS SERVICE
PRINCETON, NJ -- Many Americans sitting down to feast on a traditional Thanksgiving meal this week are likely to feel conflicted about the calories on their plates. Close to half of Americans, 44%, tell Gallup they are overweight; a solid majority, 59%, say they would like to lose weight; and 66% indicate they weigh more than their preferred "ideal" weight. For better or worse, only 25% are actively trying to lose weight today, a figure that has changed little since the 1950s.
Weight Issues Affect Most Americans
Two-thirds of Americans, 66%, tell Gallup they weigh more than the amount they consider their ideal weight. Taking into account those who are underweight, three-quarters of Americans (77%) indicate they have an issue with their weight of one kind or another, to a greater or lesser degree.
According to their self reports of current weight, only one in four Americans are seriously overweight -- defined as being 20 pounds over their self-defined ideal body weight. But another 17% are more than 10 pounds overweight, resulting in 42% who have a significant weight issue. At the other extreme, just 11% are underweight. A lucky 17% indicate they weigh the ideal amount.
|
National Adults |
Women |
Men |
|
|
% |
% |
% |
|
|
Underweight |
11 |
5 |
20 |
|
At ideal weight |
17 |
15 |
18 |
|
1-10 Pounds overweight |
24 |
25 |
21 |
|
11-20 Pounds overweight |
17 |
15 |
18 |
|
21+ Pounds overweight |
25 |
29 |
19 |
Mostly a Woman's Issue
There is a distinct gender imbalance in responses about body image -- women are much more concerned about weight than are men. A fairly similar number of men and women indicate they weigh more than their ideal -- 69% of women vs. 58% of men. However, women are much more likely than men to want to lose weight (68% of women vs. 49% of men). Relative to the total number who weigh more than their ideal, women are also much more likely to be taking active steps to try to lose weight (32% vs. 17%).
|
Women |
Men |
|
|
Weigh more than their ideal |
69 |
58 |
|
Want to lose weight |
68 |
49 |
|
Feel "overweight" |
49 |
38 |
|
Trying to lose weight |
32 |
17 |
Perceptions of "Ideal" Weight Inch Up as Americans Put on Pounds
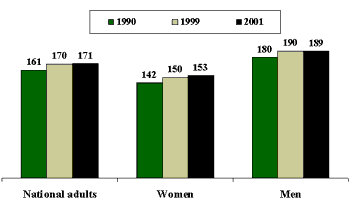
According to Americans' reports of their own body weight, the average adult woman today weighs 153 pounds and the average man weighs 189. For women, this represents an increase of three pounds since 1999 and 11 pounds since 1990. Men have gained an average of nine pounds since 1990.
| Average Body Weight In lbs |
 |
| Nov. 8-11, 2001 |
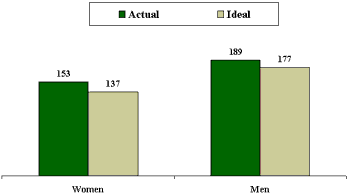
Gallup finds that as Americans have gained weight, they have adjusted their expectations of ideal body weight accordingly. In total, 66% of American adults indicated that they currently weigh more than their ideal weight. For women, the average ideal weight is 137 pounds and for men it is 177. Thus, to meet their goals, women need to lose an average of 16 pounds and men need to lose 12 pounds.
| Actual vs. Ideal Weight In lbs |
 |
| Nov. 8-11, 2001 |
While women have gained an average of 11 pounds since 1990 (from 142 pounds to 153 pounds), their conception of their ideal weight has increased by eight pounds (from 129 to 137). The pattern is the same among men. Since 1990, they have gained an average of 9 pounds (from 180 pounds to 189 pounds), and their ideal weight has grown by six pounds (from 171 to 177).
One in Four Actively Trying to Reduce Weight
Despite the high degree of concern about weight, only 25% of all Americans are currently taking steps to lose weight, and of those just 43% describe themselves as overweight. Thirty-two percent of are women are dieters, compared to just 17% of men.
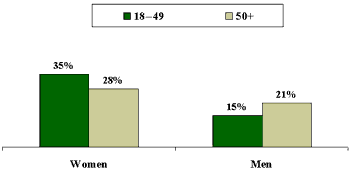
Weight reduction efforts appear to be more prevalent among blacks and other minorities than among whites, 31% vs. 24%. Dieting also appears to be particularly common among upper middle-aged Americans, those 50-64 years old. One-third of this group is currently trying to lose weight, compared to 27% of Baby Boomers, 20% of young adults and just 14% of seniors. However these age patterns differ by gender, as the highest rates of weight reduction efforts among men are found among those older than 50, while among women, those aged 18-49 are the most likely age group to be striving to shed weight.
| Trying To Lose Weight: By Age/Gender |
 |
| Nov. 8-11, 2001 |
Survey Methods
These results are based on telephone interviews with a randomly selected national sample of 1,005 adults, 18 years and older, conducted November 8-11 and a separate randomly selected national sample of 1,038 national adults interviewed July 19-22, 2001. For results based on these samples, one can say with 95 percent confidence that the maximum error attributable to sampling and other random effects is plus or minus 3 percentage points. In addition to sampling error, question wording and practical difficulties in conducting surveys can introduce error or bias into the findings of public opinion polls.
How would you describe your own personal weight situation right now -- very overweight, somewhat overweight, about right, somewhat underweight, or very underweight?
|
Very |
Somewhat over-weight |
|
Somewhat under-weight |
Very under-weight |
|
|
|
2001 Nov 8-11 |
6% |
38 |
51 |
4 |
* |
1 |
|
2001 Jul 19-22 |
5% |
41 |
49 |
5 |
* |
* |
|
1999 Jul 22-25 |
4% |
35 |
53 |
6 |
1 |
1 |
|
1990 Oct 11-14 |
7% |
41 |
46 |
5 |
1 |
* |
What is your approximate current weight?
|
124 lbs. or less |
125-149 lbs. |
150-174 lbs. |
175-199 lbs. |
200 lbs. and over |
No opinion |
Average weight |
|
|
% |
% |
% |
% |
% |
% |
% |
|
|
National Adults |
|||||||
|
2001 Nov 8-11 |
8 |
20 |
24 |
22 |
22 |
4 |
171 |
|
2001 Jul 19-22 |
8 |
19 |
26 |
20 |
22 |
5 |
173 |
|
1999 Jul 22-25 |
11 |
19 |
25 |
20 |
20 |
4 |
170 |
|
1990 Oct 11-14 |
12 |
27 |
27 |
16 |
15 |
3 |
161 |
|
Men |
|||||||
|
2001 Nov 8-11 |
1 |
8 |
22 |
33 |
35 |
1 |
189 |
|
2001 Jul 19-22 |
3 |
8 |
26 |
28 |
34 |
1 |
188 |
|
1999 Jul 22-25 |
1 |
6 |
27 |
31 |
33 |
2 |
190 |
|
1990 Oct 11-14 |
2 |
11 |
35 |
27 |
25 |
* |
180 |
|
Women |
|||||||
|
2001 Nov 8-11 |
15 |
31 |
26 |
11 |
11 |
6 |
153 |
|
2001 Jul 19-22 |
13 |
29 |
26 |
12 |
12 |
8 |
158 |
|
1999 Jul 22-25 |
20 |
32 |
24 |
9 |
8 |
7 |
150 |
|
1990 Oct 11-14 |
21 |
42 |
20 |
7 |
5 |
5 |
142 |
Would you like to [ROTATED: lose weight, stay at your present weight, or put on weight]?
|
Lose weight |
Put on weight |
Stay at present |
No opinion |
|
|
% |
% |
% |
% |
|
|
National Adults |
||||
|
2001 Jul 19-22 |
59 |
7 |
34 |
* |
|
1999 Jul 22-25 |
52 |
9 |
39 |
* |
|
1996 Feb 23-25 |
55 |
4 |
41 |
* |
|
1990 Oct 11-14 |
52 |
7 |
40 |
1 |
|
1955 Jun 24-29 |
37 |
13 |
48 |
2 |
|
1954 Jul 2-7 |
35 |
14 |
50 |
1 |
|
1953 Feb 1-5 |
37 |
13 |
49 |
1 |
|
1951 |
31 |
17 |
50 |
2 |
|
Men |
||||
|
2001 Jul 19-22 |
49 |
12 |
39 |
0 |
|
1999 Jul 22-25 |
44 |
13 |
43 |
* |
|
1996 Feb 23-25 |
45 |
6 |
49 |
* |
|
Women |
||||
|
2001 Jul 19-22 |
68 |
2 |
30 |
* |
|
1999 Jul 22-25 |
58 |
5 |
37 |
* |
|
1996 Feb 23-25 |
63 |
3 |
34 |
* |
What do you think is the ideal body weight for you, personally?
|
124 lbs. or less |
125-149 lbs. |
150-174 lbs. |
175-199 lbs. |
200 lbs. and over |
No opinion |
Average weight |
|
|
% |
% |
% |
% |
% |
% |
||
|
National Adults |
|||||||
|
2001 Jul 19-22 |
11 |
31 |
26 |
20 |
9 |
3 |
156 |
|
1999 Jul 22-25 |
13 |
31 |
23 |
19 |
12 |
3 |
157 |
|
1990 Oct 11-14 |
18 |
32 |
24 |
16 |
6 |
4 |
149 |
|
Men |
|||||||
|
2001 Jul 19-22 |
2 |
8 |
31 |
38 |
19 |
2 |
177 |
|
1999 Jul 22-25 |
* |
8 |
28 |
37 |
23 |
3 |
180 |
|
1990 Oct 11-14 |
1 |
10 |
41 |
33 |
12 |
3 |
171 |
|
Women |
|||||||
|
2001 Jul 19-22 |
20 |
51 |
22 |
3 |
* |
4 |
137 |
|
1999 Jul 22-25 |
25 |
52 |
17 |
3 |
1 |
2 |
136 |
|
1990 Oct 11-14 |
32 |
51 |
10 |
2 |
* |
5 |
129 |
At this time are you seriously trying to lose weight?
|
|
Yes |
No |
No opinion |
|
% |
% |
% |
|
|
National Adults |
|||
|
2001 Jul 19-22 |
25 |
75 |
* |
|
1999 Jul 22-25 |
20 |
80 |
* |
|
1996 Feb 23-25 |
26 |
74 |
* |
|
1990 Oct 11-14 |
18 |
82 |
* |
|
1955 |
17 |
83 |
* |
|
1953 |
25 |
75 |
* |
|
1951 |
19 |
81 |
* |
|
Men |
|||
|
2001 Jul 19-22 |
17 |
82 |
1 |
|
1999 Jul 22-25 |
16 |
84 |
* |
|
1996 Feb 23-25 |
22 |
78 |
* |
|
1990 Oct 11-14 |
11 |
88 |
1 |
|
Women |
|||
|
2001 Jul 19-22 |
32 |
68 |
0 |
|
1999 Jul 22-25 |
24 |
76 |
* |
|
1996 Feb 23-25 |
30 |
70 |
* |
|
1990 Oct 11-14 |
24 |
76 |
* |
* -- Less than 0.5%
