GALLUP NEWS SERVICE
PRINCETON, NJ -- One of the potential outcomes of Sept. 11 that pollsters have been on the lookout for is a decline in Americans' trademark optimism. Would people's heightened fear of terrorism undermine their ability to enjoy life or look forward to the future? As President George W. Bush prepares to deliver his first State of the Union address to Congress on Tuesday night, the answers appear to be "no."
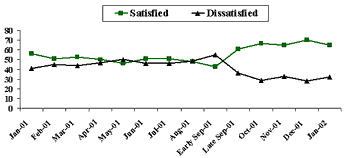
Gallup's standard measure for rating public satisfaction with the nation asks: "Are you satisfied or dissatisfied with the way things are going in the United States at this time?" Gallup asks a parallel question about Americans' personal lives. A Jan. 7-9 survey updating these trends finds that Americans' personal satisfaction level remains at 85%, identical to a year ago. Americans' satisfaction with the nation, on the other hand, has risen significantly, from 56% in January 2001 to 65% today. The trend line for 2001 clearly shows that Americans' satisfaction with the country started to lag over the summer, at the same time that concerns mounted about the nation's economy. That all changed on Sept. 11, after which Americans became much more positive about the direction of the nation.
| Satisfaction With Way Things Are Going in
U.S. 2001-2002 |
 |
Beyond this general measure, Gallup gauges the mood of Americans using a series of questions first asked in 1959. Known as Gallup's "striving scale," respondents use a scale from 0 to 10 to rate their personal lives and the nation -- not just at present but looking back five years and looking ahead five years. This affords a more precise look at how Americans view both their lives and the nation.
Using this measure, the Jan. 7-9 survey indicates that Americans are slightly less positive today than they were last year about the current state of affairs in both their personal lives and the nation. Nevertheless, their ratings on both dimensions remain highly positive. Strikingly, their outlook for the future has brightened significantly over the same time frame.
State of the Nation Ratings
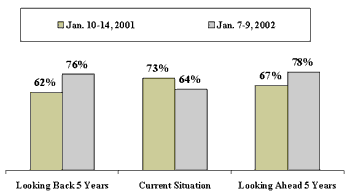
Americans' perceptions of where the country stands today on Gallup's striving scale are slightly lower than they were a year ago: 64% today give the nation positive scores versus 73% in 2001.
With respect to where the country stood five years ago, Americans have a more glowing retrospective evaluation today than they did last year: 76% today say the situation five years ago was positive, compared to 62% who felt this way last year.
When asked to look ahead, Americans are highly optimistic. Nearly four in five, 78%, have a positive outlook for the country's future, compared with two-thirds who felt this way a year ago.
| State of the Nation Striving Scale: Positive Rating Score of 6-10 |
 |
Gallup's trends on this question reveal how positively Americans perceive the state of the nation today, compared to how they felt in previous years. In fact, the ratings for looking back five years ago and ahead five years from now are the highest Gallup has ever obtained.
|
State of the Nation Trend -- Positive Rating Score of 6-10
|
||||
|
Looking Back 5 Years |
Current Situation |
Looking Ahead 5 Years |
||
|
% |
% |
% |
||
|
2002 Jan 7-9 |
76 |
64 |
78 |
|
|
2001 Jan 10-14 |
62 |
73 |
67 |
|
|
1991 May 23-26 |
52 |
53 |
56 |
|
|
1985 Mar |
42 |
57 |
65 |
|
|
1979 Aug |
62 |
34 |
48 |
|
|
1974 Apr † |
63 |
33 |
52 |
|
|
1972 May ‡ |
49 |
45 |
60 |
|
|
1971 Jan 8-11 † |
61 |
39 |
56 |
|
|
1959 Aug ‡ |
61 |
68 |
74 |
|
|
† |
Gallup/Potomac |
|||
|
‡ |
Gallup/Institute for International Social Research |
|||
Personal Life Ratings
A majority of Americans, 73%, rate their personal lives today in positive terms, giving scores between 6 and 10. Another 18% give their lives a more neutral score of 5. Only 9% rate their lives negatively, scoring it from 0 to 4.
Last year at this time, Americans were only slightly more upbeat about their lives and about what they expected in the five years following. They were not quite as upbeat about their lives five years ago as are Americans in the current poll.
| Personal Life Striving Scale: Positive Rating Score of 6-10 |
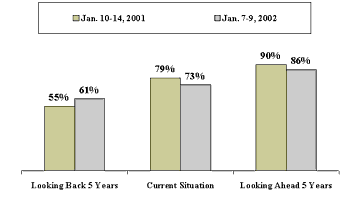 |
While down slightly from last year, Americans' current ratings of their personal life compare favorably with earlier times in Gallup's records, particularly the early 1970s. In that period, only 62%-64% of Americans used positive scores to describe their current situation. Their outlook for the future was 11 to 16 points lower than it is today.
|
Personal Life Trend -- Positive Rating Score (6-10)
|
|||
|
Looking Back 5 Years |
Current Situation |
Looking Ahead 5 Years |
|
|
% |
% |
% |
|
|
2002 Jan 7-9 |
61 |
73 |
86 |
|
2001 Jan 10-14 |
55 |
79 |
90 |
|
1998 Apr 23-May 31 |
50 |
80 |
86 |
|
1985 Mar |
52 |
67 |
78 |
|
1979 Aug |
52 |
65 |
75 |
|
1976 Jun |
51 |
68 |
78 |
|
1974 Apr |
46 |
64 |
73 |
|
1972 May |
47 |
62 |
75 |
|
1971 Jan |
52 |
64 |
70 |
|
1964 Sep |
52 |
69 |
79 |
Survey Methods
These results are based on telephone interviews with a randomly selected national sample of 1,015 adults, 18 years and older, conducted Jan. 7-9, 2002. For results based on this sample, one can say with 95 percent confidence that the maximum error attributable to sampling and other random effects is plus or minus 3 percentage points. In addition to sampling error, question wording and practical difficulties in conducting surveys can introduce error or bias into the findings of public opinion polls.
We'd like you to imagine a ladder with steps numbered from zero at the bottom to ten at the top. Suppose the top of the ladder represents the best possible situation for our country and the bottom represents the worst possible situation. Please tell me the number of the step on which you think the United States stands at the present time?
|
Worst |
1 |
2 |
3 |
4 |
5 |
6 |
7 |
8 |
9 |
Best |
DK/ |
|
||
|
% |
% |
% |
% |
% |
% |
% |
% |
% |
% |
% |
% |
|||
|
2002 Jan 7-9 |
* |
* |
1 |
2 |
10 |
22 |
23 |
24 |
10 |
3 |
4 |
1 |
6.2 |
|
|
2001 Jan 10-14 |
* |
* |
1 |
1 |
5 |
18 |
19 |
31 |
16 |
4 |
3 |
2 |
6.5 |
|
|
1991 May 23-26 |
1 |
1 |
3 |
5 |
10 |
24 |
16 |
17 |
11 |
3 |
6 |
3 |
5.9 |
|
|
1985 Mar 8-11 |
1 |
1 |
1 |
5 |
12 |
22 |
19 |
22 |
10 |
4 |
2 |
3 |
5.9 |
|
|
1979 Aug 10-13 |
1 |
1 |
5 |
12 |
16 |
28 |
16 |
11 |
5 |
1 |
1 |
2 |
5.0 |
|
|
1976 Jun ^ |
1 |
1 |
3 |
8 |
13 |
27 |
16 |
13 |
8 |
4 |
4 |
2 |
5.6 |
|
|
1974 Apr † |
4 |
4 |
7 |
11 |
16 |
23 |
14 |
9 |
4 |
2 |
4 |
3 |
4.8 |
|
|
1972 May † |
1 |
2 |
4 |
9 |
12 |
25 |
14 |
15 |
9 |
2 |
5 |
2 |
5.5 |
|
|
1971 Jan 8-11 † |
1 |
1 |
3 |
11 |
12 |
28 |
14 |
12 |
7 |
3 |
3 |
5 |
5.4 |
|
|
1964 Sep † |
* |
1 |
1 |
4 |
6 |
20 |
14 |
20 |
16 |
6 |
8 |
4 |
6.5 |
|
|
1959 Aug ‡ |
1 |
* |
1 |
4 |
6 |
19 |
14 |
19 |
17 |
7 |
11 |
1 |
6.7 |
|
|
* |
Less than 0.5% |
|||||||||||||
|
^ |
Gallup/Potomac and Institute for International Social Research |
|||||||||||||
|
† |
Gallup/Potomac |
|||||||||||||
|
‡ |
Gallup/Institute for International Social Research |
|||||||||||||
What is the number of the step on which you think the U.S. stood about five years ago?
|
Worst |
1 |
2 |
3 |
4 |
5 |
6 |
7 |
8 |
9 |
Best |
DK/ |
|
||
|
% |
% |
% |
% |
% |
% |
% |
% |
% |
% |
% |
% |
|||
|
2002 Jan 7-9 |
* |
1 |
1 |
2 |
7 |
11 |
15 |
16 |
25 |
12 |
8 |
2 |
6.9 |
|
|
2001 Jan 10-14 |
* |
* |
1 |
4 |
6 |
23 |
17 |
15 |
19 |
7 |
4 |
4 |
6.3 |
|
|
1991 May 23-26 |
1 |
1 |
3 |
5 |
11 |
22 |
15 |
17 |
13 |
3 |
4 |
5 |
5.9 |
|
|
1985 Mar 8-11 |
1 |
1 |
5 |
11 |
18 |
20 |
17 |
13 |
7 |
3 |
2 |
3 |
5.2 |
|
|
1979 Aug 10-13 |
0 |
3 |
2 |
5 |
9 |
17 |
17 |
19 |
16 |
7 |
3 |
3 |
6.1 |
|
|
1974 Apr ^ |
1 |
2 |
4 |
4 |
8 |
17 |
16 |
20 |
15 |
7 |
5 |
1 |
6.1 |
|
|
1972 May ^ |
1 |
2 |
4 |
6 |
14 |
21 |
16 |
14 |
10 |
5 |
4 |
3 |
5.6 |
|
|
1971 Jan 8-11 ^ |
* |
1 |
2 |
6 |
9 |
18 |
16 |
19 |
15 |
6 |
5 |
4 |
6.2 |
|
|
1959 Aug † |
1 |
1 |
2 |
6 |
10 |
15 |
13 |
17 |
16 |
5 |
10 |
6 |
6.3 |
|
|
* |
Less than 0.5% |
|||||||||||||
|
^ |
Gallup/Potomac |
|||||||||||||
|
† |
Gallup/Institute for International Social Research |
|||||||||||||
And just your best guess, if things go pretty much as you now expect, what is the number of the step on which you think the U.S. will stand, about five years from now?
|
Worst |
1 |
2 |
3 |
4 |
5 |
6 |
7 |
8 |
9 |
Best |
DK/ |
|
||
|
% |
% |
% |
% |
% |
% |
% |
% |
% |
% |
% |
% |
|||
|
2002 Jan 7-9 |
1 |
1 |
1 |
3 |
5 |
9 |
9 |
17 |
29 |
14 |
9 |
2 |
7.1 |
|
|
2001 Jan 10-14 |
1 |
1 |
3 |
4 |
7 |
13 |
12 |
16 |
23 |
10 |
6 |
4 |
6.6 |
|
|
1991 May 23-26 |
3 |
3 |
4 |
7 |
6 |
13 |
10 |
14 |
17 |
7 |
8 |
8 |
6.1 |
|
|
1985 Mar 8-11 |
2 |
1 |
3 |
6 |
5 |
10 |
11 |
17 |
20 |
12 |
5 |
8 |
6.5 |
|
|
1979 Aug 10-13 |
* |
8 |
6 |
7 |
10 |
12 |
12 |
12 |
13 |
6 |
5 |
9 |
5.5 |
|
|
1974 Apr ^ |
5 |
4 |
5 |
6 |
7 |
11 |
9 |
12 |
14 |
8 |
9 |
10 |
5.9 |
|
|
1972 May ^ |
2 |
3 |
3 |
8 |
7 |
9 |
11 |
12 |
16 |
11 |
10 |
8 |
6.3 |
|
|
1971 Jan 8-11 ^ |
2 |
3 |
4 |
6 |
6 |
10 |
10 |
14 |
15 |
9 |
8 |
13 |
6.2 |
|
|
1959 Aug † |
1 |
1 |
2 |
3 |
3 |
8 |
8 |
14 |
18 |
13 |
21 |
8 |
7.4 |
|
|
* |
Less than 0.5% |
|||||||||||||
|
^ |
Gallup/Potomac |
|||||||||||||
|
† |
Gallup/Institute for International Social Research |
|||||||||||||
Again, please think about a picture of a ladder. Suppose that the top of the ladder represents the best possible life for you, and the bottom represents the worst possible life for you. If the top step is "10" and the bottom step is "0", on which step of the ladder do you feel you personally stand at the present time?
|
Worst |
1 |
2 |
3 |
4 |
5 |
6 |
7 |
8 |
9 |
Best |
DK/ |
|
||
|
% |
% |
% |
% |
% |
% |
% |
% |
% |
% |
% |
% |
|||
|
2002 Jan 7-9 |
* |
0 |
1 |
2 |
6 |
18 |
16 |
22 |
20 |
9 |
6 |
* |
6.7 |
|
|
2001 Jan 10-14 |
* |
* |
1 |
2 |
4 |
13 |
16 |
22 |
23 |
10 |
8 |
1 |
7.0 |
|
|
1998 Apr 23-May 31 |
1 |
* |
* |
2 |
4 |
13 |
12 |
24 |
27 |
8 |
9 |
* |
7.1 |
|
|
1985 Mar 8-11 |
0 |
1 |
2 |
5 |
7 |
18 |
16 |
20 |
19 |
6 |
6 |
* |
6.4 |
|
|
1979 Aug 10-13 |
1 |
1 |
1 |
5 |
6 |
19 |
13 |
18 |
18 |
8 |
8 |
2 |
6.5 |
|
|
1976 Jun |
1 |
1 |
2 |
3 |
6 |
19 |
13 |
17 |
17 |
8 |
13 |
* |
6.7 |
|
|
1974 Apr |
2 |
3 |
2 |
3 |
6 |
20 |
12 |
16 |
18 |
8 |
10 |
* |
6.4 |
|
|
1972 May |
1 |
1 |
2 |
4 |
7 |
23 |
13 |
15 |
16 |
8 |
10 |
* |
6.4 |
|
|
1971 Jan 8-11 |
1 |
1 |
2 |
3 |
6 |
21 |
11 |
19 |
17 |
8 |
9 |
2 |
6.5 |
|
|
1964 Sep |
1 |
1 |
1 |
2 |
4 |
21 |
14 |
19 |
16 |
7 |
13 |
1 |
6.7 |
|
|
* |
Less than 0.5% |
|||||||||||||
On which step would you say you stood five years ago?
|
Worst |
1 |
2 |
3 |
4 |
5 |
6 |
7 |
8 |
9 |
Best |
DK/ |
|
||
|
% |
% |
% |
% |
% |
% |
% |
% |
% |
% |
% |
% |
|||
|
2002 Jan 7-9 |
1 |
1 |
3 |
7 |
10 |
17 |
15 |
17 |
16 |
7 |
6 |
1 |
6.2 |
|
|
2001 Jan 10-14 |
2 |
2 |
3 |
7 |
11 |
19 |
13 |
14 |
15 |
6 |
7 |
1 |
5.9 |
|
|
1998 Apr 23- |
3 |
3 |
5 |
8 |
11 |
19 |
11 |
13 |
13 |
5 |
8 |
1 |
5.7 |
|
|
1985 Mar 8-11 |
2 |
3 |
5 |
9 |
10 |
19 |
14 |
13 |
13 |
6 |
6 |
* |
5.7 |
|
|
1979 Aug 10-13 |
2 |
3 |
5 |
9 |
11 |
18 |
13 |
11 |
13 |
7 |
8 |
* |
5.8 |
|
|
1976 Jun |
4 |
3 |
6 |
9 |
11 |
16 |
11 |
11 |
12 |
7 |
10 |
* |
5.7 |
|
|
1974 Apr |
4 |
4 |
7 |
11 |
11 |
17 |
11 |
11 |
10 |
6 |
8 |
* |
5.4 |
|
|
1972 May |
4 |
4 |
6 |
8 |
12 |
19 |
11 |
12 |
11 |
6 |
7 |
* |
5.5 |
|
|
1971 Jan 8-11 |
2 |
3 |
5 |
9 |
10 |
18 |
12 |
13 |
11 |
7 |
9 |
1 |
5.8 |
|
|
1964 Sep |
2 |
3 |
5 |
8 |
10 |
19 |
13 |
11 |
11 |
6 |
11 |
1 |
5.8 |
|
|
* |
Less than 0.5% |
|||||||||||||
And just your best guess, on which step do you think you will stand in the future, say about five years from now?
|
Worst |
1 |
2 |
3 |
4 |
5 |
6 |
7 |
8 |
9 |
Best |
DK/ |
|
||
|
% |
% |
% |
% |
% |
% |
% |
% |
% |
% |
% |
% |
|||
|
2002 Jan 7-9 |
* |
1 |
* |
1 |
4 |
7 |
5 |
14 |
26 |
21 |
20 |
1 |
7.9 |
|
|
2001 Jan 10-14 |
1 |
* |
1 |
1 |
1 |
4 |
5 |
12 |
26 |
24 |
23 |
2 |
8.1 |
|
|
1998 Apr 23- |
1 |
* |
* |
1 |
2 |
5 |
4 |
10 |
24 |
22 |
26 |
5 |
8.2 |
|
|
1985 Mar 8-11 |
1 |
1 |
2 |
2 |
3 |
7 |
7 |
12 |
23 |
18 |
18 |
6 |
7.6 |
|
|
1979 Aug 10-13 |
1 |
2 |
1 |
3 |
3 |
9 |
6 |
12 |
20 |
18 |
19 |
6 |
7.5 |
|
|
1976 Jun |
2 |
1 |
2 |
2 |
2 |
5 |
6 |
12 |
19 |
18 |
23 |
8 |
7.7 |
|
|
1974 Apr |
2 |
2 |
2 |
3 |
2 |
7 |
6 |
12 |
18 |
16 |
21 |
9 |
7.4 |
|
|
1972 May |
1 |
1 |
2 |
2 |
3 |
7 |
6 |
11 |
20 |
17 |
21 |
9 |
7.6 |
|
|
1971 Jan 8-11 |
2 |
1 |
2 |
2 |
2 |
7 |
7 |
11 |
18 |
15 |
19 |
14 |
7.5 |
|
|
1964 Sep |
1 |
0 |
1 |
1 |
2 |
6 |
7 |
15 |
20 |
15 |
22 |
10 |
7.8 |
|
|
* |
Less than 0.5% |
|||||||||||||