GALLUP NEWS SERVICE
PRINCETON, NJ -- According to the latest CNN/USA Today/Gallup poll, conducted October 3-6, Americans who identify themselves as "Hispanic" show a decided preference for the Democratic Party -- both in party affiliation and in their intended vote in November. Turnout among Hispanics is estimated to be about 32%, only slightly lower than the overall Gallup projected turnout of 35% among all Americans.
The poll included an oversample of self-identified Hispanics, with a total sample size of 250 nationwide (the interviews with Hispanics were conducted in both English and Spanish based on the respondent's preference). Because of the small sample, the margin of error (±7 percentage points) is larger than the margin of error of most national polls. Still, the results provide reliable and interesting insights into the nature of the Latino population.
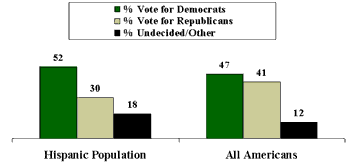
Among all Hispanics, Democrats enjoy a 22-point lead in the contest for Congress, with 52% of Hispanics expressing support for the Democratic candidate in their congressional district and 30% for the Republican. Among those Hispanic respondents classified by Gallup's series of voting questions as most likely to vote, the Democratic advantage is only slightly smaller.
By comparison, among all adults nationwide, Democrats enjoy only a six-point lead, 47% to 41%. Among likely voters, the margin shrinks to just one percentage point, 48% to 47%.
| Vote Choice in Congressional Elections |
 |
| Oct. 3-6, 2002 |
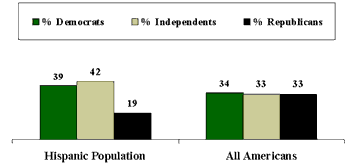
The congressional vote is reflective of the Democratic advantage in Hispanic party affiliation. The poll shows that among all Hispanics, 39% say they are Democrats, 42% independents, and 19% Republicans. Among all Americans, party affiliation is much more competitive. The current poll shows 34% for Republicans, and 33% each for independents and Democrats.
| Party Affiliation Compared by Hispanics and All Americans |
 |
| Oct. 3-6, 2002 |
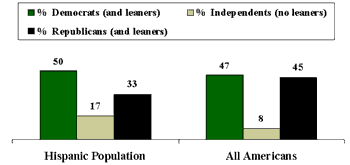
The picture changes slightly when independents are asked if they lean toward one party or the other. Among Hispanics, the 42% who are independents break slightly more to the Republican Party (14%) than to the Democratic Party (11%), leaving just 17% who are independent and do not lean toward either side. Thus, 50% of Hispanics express some degree of attachment to the Democratic Party and 33% to the GOP.
Among all Americans, independents break slightly more to the Democratic Party (14%) than to the Republican Party (11%). Thus, the final total shows 45% Republicans, 8% independents who do not lean, and 47% Democrats.
| Party Affiliation (Including Leaners) Compared by Hispanics and All Americans |
 |
| Oct. 3-6, 2002 |
Democrats Seen as More Caring and More Likely to Share Public's Values -- Especially Among Hispanics
Other indications that the Hispanic population favors the Democratic Party are found in two questions that asked respondents to compare the two major parties on caring about the public's needs and, separately, representing its values.
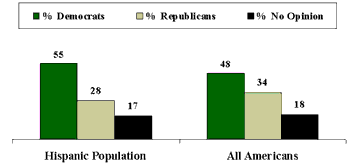
By a 2-to-1 margin, 55% to 28%, Hispanics say the Democratic rather than the Republican Party "cares more about the needs of people like you." Among all Americans, the Democratic Party is also viewed as more caring than the GOP, but by a smaller margin of 48% to 34%.
| Which Party "Cares More About the Needs of People Like You"? |
 |
| Oct. 3-6, 2002 |
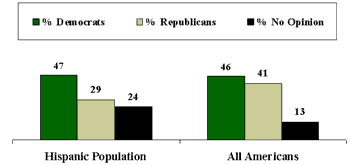
Similarly, by an 18-point margin, 47% to 29%, Hispanics say the Democratic Party more than the Republican Party "better shares your values." Among all Americans, the Democrats hold only a slight five-point advantage on this trait, 46% to 41%.
| Which Party "Better Shares Your Values"? |
 |
| Oct. 3-6, 2002 |
Bush Popularity Overrides Party
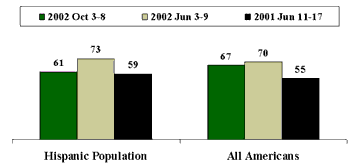
Despite the fact that Hispanics are more likely to identify with the Democratic Party than the national population more generally, they express almost as much support for President George W. Bush as do the rest of Americans. Among Hispanics, Bush's approval rating is 61%, compared with 67% among all Americans. While the current poll finds a slightly lower approval rating among Hispanics than is the case among the rest of the population, Bush's approval rating was slightly higher among Hispanics in two previous polls. In June 2002, 73% of Hispanics approved of Bush's performance, compared with 70% of all Americans. A year earlier, 59% of Hispanics, compared with 55% of all Americans, approved of Bush's performance.
| Percentage Who Approve of President Bush's Job Performance |
 |
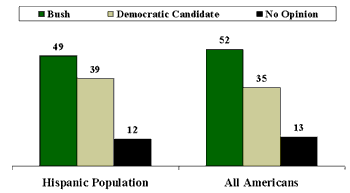
While it is much too early to predict the outcome of the 2004 presidential election, the current poll finds that Bush's electoral prospects today are almost as strong among Hispanics as among the population overall. By a margin of 49% to 39%, Hispanics say they are more likely to vote for Bush than for "the Democratic Party's candidate for president" in the 2004 election. Among Americans overall, 52% say they would vote for Bush, while 35% would vote for his opponent.
| Who Will You Vote for in the 2004 Presidential Election? |
 |
| Oct. 3-6, 2002 |
Survey Methods
Results for the national sample are based on telephone interviews with 1,502 national adults, aged 18 and older, conducted Oct. 3-6, 2002, including 806 likely voters. For results based on the total sample, one can say with 95% confidence that the margin of sampling error is ±3 percentage points. The margin of error for the likely voter sample is ±4 percentage points.
Results for the Hispanic respondents are based on telephone interviews with 275 Hispanics, aged 18 and older, conducted Oct. 3-8, 2002. For results based on the total sample of Hispanics, one can say with 95% confidence that the maximum margin of sampling error is ±7 percentage points.
In addition to sampling error, question wording and practical difficulties in conducting surveys can introduce error or bias into the findings of public opinion polls.
