GALLUP NEWS SERVICE
PRINCETON, NJ -- A review of the American public's attitudes in the days leading into yesterday's elections shows that voters were in no mood to "throw the bums out" and change Congress dramatically. Approval of Congress in general is higher than it has been in most recent midterm elections, and a majority of the public has a favorable opinion of both political parties. Additionally, available evidence suggests that voters were generally satisfied with the way this year's campaigns were conducted, and Americans were slightly less likely to perceive the tone of this year's campaigns as negative than they were in 1998.
No Strong "Throw the Bums Out" Sentiment This Year
The public's approval of the job Congress is doing -- now at 50% -- is higher than it was prior to the midterm elections of 1982, 1990, 1994, or even 1998.
| Congressional Job Approval |
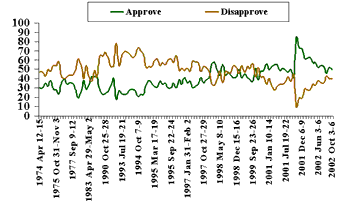 |
Indeed, the current 50% approval rating is part of a relatively recent phenomenon in which Congress has rebounded from many years of poor ratings from the public. Gallup began using the "approve/disapprove" structure for asking about Congress in 1974. It was not until early 1998, however, that the congressional approval rating broke the 50% barrier for the first time. Ratings of Congress stayed relatively high in the three years after that point, jumped much higher in the general rally effect that took place after the Sept. 11 terrorist attacks, and have gradually fallen back since that time.
Still, the current congressional job approval of 50% is the highest "pre-election" congressional approval Gallup has measured.
Of particular importance is the comparison with the midterm elections in 1994, when approval of Congress was at only 23% in the last poll conducted before the election. In that election, voters brought about a substantial turnover in Congress, with more than 50 seats -- and majority control of the House -- going from the Democrats to the Republicans.
In 1998, public approval of Congress just before the election was at 44%, even though it had been above the 50% level earlier in the year. In that election, the Republicans lost five seats.
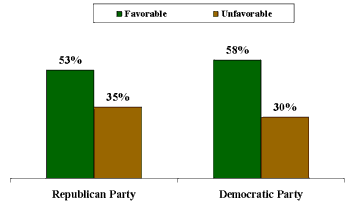
Americans have relatively positive views of the two major parties at this point, as well. Only 35% have an unfavorable opinion of the Republican Party, and only 30% have an unfavorable opinion about the Democratic Party.
| Opinion of Political Parties Next, please tell me whether you have a favorable or unfavorable opinion of each of the following parties. How about -- [ITEMS ROTATED]? |
 |
| Oct. 21-22, 2002 |
The Republican Party's unfavorable image moved above the 50% level at several points during 1998 and 1999, coincident with the Clinton impeachment process. For the Democrats, the 30% unfavorable rating represents a slightly less negative rating than their average across the years. The only other time when Democrats have had such a low unfavorable rating was in 1998. The Democrats have never had an unfavorable rating above 50% in the last decade.
These results suggest that voters in yesterday's elections were not interested in sending a strong message of disapproval to either of the two major parties, nor were the results based on a strong disapproval for the way the currently configured Congress has conducted its business.
Mixed Feelings About the Importance of the Election
Some observers argue that turnout is low in midterm elections because voters no longer care who controls Congress. Our review of recent survey data reflects mixed support for this hypothesis.
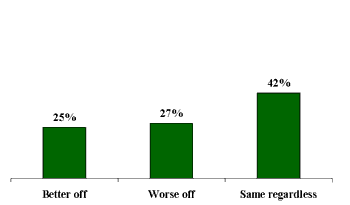
We recently asked one question that gets directly to the point: "Do you think the country would be better off if the Republicans controlled Congress, if the Democrats controlled Congress, or would the country be the same regardless of which party controlled Congress?"
| Do you think the country would be better off if the Republicans controlled Congress, if the Democrats controlled Congress, or would the country be the same regardless of which party controlled Congress? |
 |
| Oct. 31-Nov. 3, 2002 |
The national adult population (many of whom did not vote yesterday) splits roughly evenly in terms of the party it would prefer to have control of Congress (those Gallup identified as likely voters had a preference for Republican control).
What is of greater interest, perhaps, is the finding that 42% of national adults say that it doesn't matter to them which party is in office, and another 6% don't have an opinion on the issue at all. This means that about half of the public didn't seem to care who won control of Congress this election. (Of course, as noted, many of these individuals manifested that indifference by not voting.)
There are interesting disparities in the prevalence of indifference by age and other demographic characteristics:
- Younger Americans are the most indifferent to the issue of who controls Congress. Half of all adults aged 18-29 say the country would be the same regardless of which party controlled Congress, compared with 47% of adults aged 30-49, 36% of adults aged 50-64, and only 34% of adults aged 65 and older.
- Americans in the lower income brackets are more inclined to say the country would be the same regardless of which party controlled Congress. Forty-seven percent of adults earning less than $30,000 per year offer this response, compared with 45% of adults earning between $30,000-$49,999, 42% earning between $50,000-$74,999, and only 35% earning at least $75,000 per year.
- Education levels also have an impact on views on control of Congress. Only about three in 10 adults with postgraduate educations say the country would be the same regardless of which party controlled Congress, while 36% of college graduates, 47% of people with some college education, and 45% of people with a high school diploma or less feel this way.
An additional interesting result comes from a question that asks the public the following:
Suppose that after the November elections most of the present members of Congress are replaced with new members. Do you think it would change Congress for the better, change Congress for the worse, or not make much difference?
|
|
|
Not make |
No |
|
|
2002 Oct 21-22 |
26% |
8 |
61 |
5 |
|
1994 Oct 22-25 |
40% |
5 |
51 |
4 |
Six of 10 Americans say that in general it wouldn't matter if all of the current members were replaced with new members. About one-quarter say that things would be better if most members were replaced. It is worth nothing that this sentiment that the country would be better off with a new Congress is 14 points lower than it was in 1994, when the dominant party lost more than 50 seats.
Another question in the Oct. 21-22 poll asked voters if it were a good thing or a bad thing that "nearly all members of Congress who are seeking re-election are likely to win this November." Almost half said that was a good thing, while 31% said it was a bad thing and the rest had no opinion.
This highlights an apparent contradiction. A majority of voters say it wouldn't matter if all of the members of Congress were replaced, but on the other hand, about half also say that it is okay that most members of Congress stay in Congress. This may at least partially reflect a sense of indifference on the part of voters. Voters don't feel strongly that re-electing most members is bad for the country, but also don't seem to care if they in fact are replaced.
A recent UBS/Gallup Index of Investor Optimism survey asked investors (those with $10,000 or more of investable assets) to rate how significantly they felt the outcome of the congressional elections would affect the investment climate in the United States. Only 14% said the elections would affect the climate a "great deal." About half of the rest said the investment climate would be affected a moderate amount, while the remainder said it would be affected only a little or not at all.
Public Rates the Conduct of Campaigns for Congress This Year
Has the conduct of the campaigns this year depressed voter turnout? This is a common theme heard around many elections, and this year is no exception. There have been reports of large numbers of negative ads in many close campaigns, and as is usually the case, some observers argue that this tends to discourage voters, who become disgusted with the entire process.
An Oct. 21-22 CNN/USA Today/Gallup poll asked Americans several questions about the tone of their local candidates' campaigns and the political advertisements for candidates seeking congressional office this year. The poll shows that the public is generally satisfied with the conduct of the campaigns this year, although Americans feel that the political ads for candidates are generally negative.
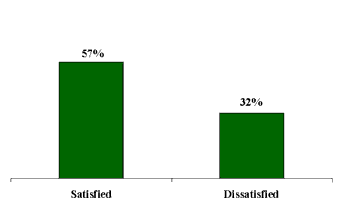
Americans were first asked if they are generally satisfied or dissatisfied with the way congressional candidates in their area have conducted their campaigns this year. A majority of respondents, 57%, say they are satisfied with the campaigns, while one third, 33%, say they are dissatisfied.
| Are you generally satisfied or dissatisfied with the way the congressional candidates in your area have conducted their campaigns this year? |
 |
| Oct. 21-22, 2002 |
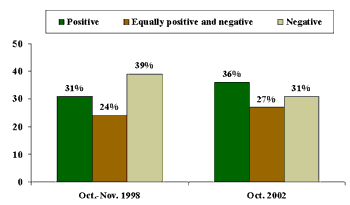
When asked to describe the tone of the candidates in the elections, Americans are split into three different groups: 36% say candidates have a generally positive tone, 27% say the tone is equally positive and negative, and 31% say the candidates' tone is generally negative.
By way of comparison, on the eve of the 1998 elections, more Americans said the candidates' tone was negative than positive, by a 39% to 31% margin.
| Thinking about the congressional campaigns this year, would you describe the tone of the candidates as generally -- [ROTATED: highly positive, somewhat positive, equally positive and negative, somewhat negative, (or) highly negative]? |
 |
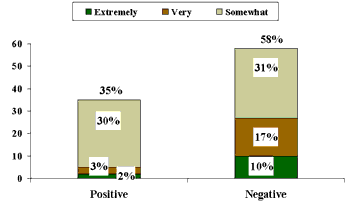
Despite Americans' general satisfaction with this year's campaigning, they are well aware of the negative nature of many of the political ads being shown on television. Two additional questions in the Oct. 21-22 poll asked Americans to evaluate television commercials for candidates for political office this election season. Nearly 6 in 10 respondents, 58%, said they feel the television ads for political candidates are at least somewhat negative, including 27% who said the ads are "extremely" or "very" negative. Only about one third of adults feel the television commercials for candidates are positive, and only 5% feel the ads are "extremely" or "very" positive.
| Would you say most of the television commercials that you have seen for candidates for political office this year are -- [ROTATED: extremely positive, very positive, somewhat positive, somewhat negative, very negative, (or) extremely negative]? |
 |
| Oct. 21-22, 2002 |
But while a majority of Americans feel the current television commercials for candidates seeking office have been negative, only about one third feel the ads are more negative this year than they have been in previous elections. More than 4 in 10 adults, 43%, feel the ads are about the same as in past elections, and only one in six respondents, 17%, feel the ads are more positive this year.
Survey Methods
These results are based on telephone interviews from four polls with randomly selected national samples of adults aged 18 and older. The polls were conducted among 1,221 national adults from Oct. 31-Nov. 3, 2002; 1,018 national adults from Oct. 21-22, 2002; 1,001 investors from Oct. 1-17, 2002; and 1,502 national adults from Oct. 3-6, 2002. For results based on these samples, one can say with 95 percent confidence that the maximum error attributable to sampling and other random effects is plus or minus 3 percentage points. In addition to sampling error, question wording and practical difficulties in conducting surveys can introduce error or bias into the findings of public opinion polls.
Do you think the country would be better off if the Republicans controlled Congress, if the Democrats controlled Congress, or would the country be the same regardless of which party controlled Congress?
|
|
|
Same |
No |
|
|
Likely Voters |
% |
% |
% |
% |
|
2002 Oct 31-Nov 3 |
38 |
29 |
30 |
3 |
|
1998 Oct 23-25 |
32 |
27 |
37 |
4 |
|
Registered Voters |
||||
|
2002 Oct 31-Nov 3 |
27 |
28 |
40 |
5 |
|
1998 Oct 23-25 |
25 |
23 |
47 |
5 |
|
National Adults |
||||
|
2002 Oct 31-Nov 3 |
25 |
27 |
42 |
6 |
|
1998 Oct 23-25 |
24 |
22 |
48 |
6 |
Suppose that after the November elections most of the present members of Congress are replaced with new members. Do you think it would change Congress for the better, change Congress for the worse, or not make much difference?
[BASED ON -- 527 -- NATIONAL ADULTS IN FORM A]
|
|
|
Not make |
No |
|
|
2002 Oct 21-22 |
26% |
8 |
61 |
5 |
|
1994 Oct 22-25 |
40% |
5 |
51 |
4 |
As you may know, nearly all members of Congress who are seeking re-election are likely to win this November. Do you think this is -- [ROTATED: good for the country, (or) bad for the country]?
[BASED ON -- 491 -- NATIONAL ADULTS IN FORM B]
|
Good for country |
Bad for country |
No opinion |
|
|
2002 Oct 21-22 |
47% |
31 |
22 |
Are you generally satisfied or dissatisfied with the way the congressional candidates in your area have conducted their campaigns this year?
|
Satisfied |
Dissatisfied |
MIXED (vol.) |
No opinion |
|
|
2002 Oct 21-22 |
57% |
32 |
4 |
7 |
|
1998 Oct 23-25 ^ |
52% |
40 |
2 |
6 |
|
(vol.) Volunteered response |
||||
|
^ WORDING: Are you generally satisfied or dissatisfied with the way the candidates running in your area have conducted their campaigns this year? |
||||
Thinking about the congressional campaigns this year, would you describe the tone of the candidates as generally -- [ROTATED: highly positive, somewhat positive, equally positive and negative, somewhat negative, (or) highly negative]?
|
|
|
Equally positive/ |
|
|
|
|
|
2002 Oct 21-22 |
5% |
31 |
27 |
21 |
10 |
6 |
|
1998 Oct 29-Nov 1 |
5% |
26 |
24 |
22 |
17 |
6 |
Would you say most of the television commercials that you have seen for candidates for political office this year are -- [ROTATED: extremely positive, very positive, somewhat positive, somewhat negative, very negative, (or) extremely negative]?
|
|
|
Some- |
Some- |
|
|
|
|
|
2002 Oct 21-22 |
2% |
3 |
30 |
31 |
17 |
10 |
7 |
Compared to past elections, would you say that television commercials for candidates for political office are -- [ROTATED: more positive, about the same, or more negative]?
|
More positive |
About the same |
More negative |
No opinion |
|
|
2002 Oct 21-22 |
17% |
43 |
34 |
6 |
Next, please tell me whether you have a favorable or unfavorable opinion of each of the following parties. How about -- [ITEMS ROTATED]?
A. The Republican Party
|
Favorable |
Unfavorable |
NEVER HEARD OF (vol.) |
No opinion |
|
|
% |
% |
% |
% |
|
|
(NA) 2002 Oct 21-22 |
53 |
35 |
* |
12 |
|
(NA) 2002 Sep 5-8 |
54 |
40 |
0 |
6 |
|
(NA) 2002 Jul 26-28 |
55 |
36 |
* |
9 |
|
(NA) 2002 Jan 11-14 |
61 |
30 |
* |
9 |
|
(NA) 2001 Sep 7-10 |
47 |
48 |
* |
5 |
|
(NA) 2000 Nov 13-15 |
49 |
43 |
* |
8 |
|
(NA) 2000 Aug 4-5 |
54 |
37 |
1 |
8 |
|
(NA) 2000 Jul 25-26 |
49 |
39 |
* |
12 |
|
(NA) 2000 Jan 7-10 |
53 |
41 |
* |
6 |
|
(NA) 1999 Nov 18-21 |
50 |
44 |
* |
6 |
|
(NA) 1999 Apr 30-May 2 |
47 |
44 |
* |
9 |
|
(NA) 1999 Feb 19-21 |
45 |
46 |
0 |
9 |
|
(NA) 1999 Feb 12-13 |
40 |
54 |
1 |
5 |
|
(NA) 1999 Feb 4-8 |
45 |
47 |
* |
8 |
|
(NA) 1999 Jan 8-10 |
40 |
52 |
* |
8 |
|
(NA) 1998 Dec 19-20 |
31 |
57 |
* |
12 |
|
(NA) 1998 Dec 15-16 |
43 |
47 |
2 |
8 |
|
(NA) 1997 Oct 27-29 |
50 |
42 |
* |
8 |
|
(RV) 1996 Aug 30-Sep 1 |
50 |
45 |
* |
5 |
|
(RV) 1996 Aug 16-18 |
55 |
41 |
1 |
2 |
|
(RV) 1996 Aug 5-7 |
51 |
44 |
* |
5 |
|
(NA) 1996 Apr 9-10 |
52 |
41 |
* |
7 |
|
(NA) 1995 Apr 17-19 |
52 |
42 |
* |
6 |
|
(RV) 1992 Jul 6-8 |
53 |
39 |
* |
8 |
B. The Democratic Party
|
Favorable |
Unfavorable |
NEVER HEARD OF (vol.) |
No opinion |
|
|
% |
% |
% |
% |
|
|
(NA) 2002 Oct 21-22 |
58 |
30 |
* |
12 |
|
(NA) 2002 Sep 5-8 |
56 |
38 |
0 |
6 |
|
(NA) 2002 Jul 26-28 |
55 |
34 |
* |
11 |
|
(NA) 2002 Jan 11-14 |
55 |
33 |
* |
12 |
|
(NA) 2001 Sep 7-10 |
56 |
38 |
* |
6 |
|
(NA) 2000 Nov 13-15 |
53 |
38 |
1 |
8 |
|
(NA) 2000 Aug 4-5 |
53 |
38 |
1 |
8 |
|
(NA) 2000 Jul 25-26 |
56 |
35 |
* |
9 |
|
(NA) 2000 Jan 7-10 |
61 |
33 |
* |
6 |
|
(NA) 1999 Nov 18-21 |
51 |
41 |
* |
8 |
|
(NA) 1999 Apr 30-May 2 |
53 |
37 |
1 |
9 |
|
(NA) 1999 Feb 19-21 |
55 |
37 |
0 |
8 |
|
(NA) 1999 Feb 12-13 |
56 |
38 |
* |
6 |
|
(NA) 1999 Feb 4-8 |
57 |
37 |
* |
6 |
|
(NA) 1999 Jan 8-10 |
57 |
35 |
* |
8 |
|
(NA) 1998 Dec 19-20 |
57 |
30 |
* |
13 |
|
(NA) 1998 Dec 15-16 |
58 |
32 |
2 |
8 |
|
(NA) 1997 Oct 27-29 |
54 |
39 |
* |
7 |
|
(RV) 1996 Aug 30-Sep 1 |
60 |
36 |
* |
4 |
|
(RV) 1996 Aug 16-18 |
55 |
41 |
1 |
3 |
|
(RV) 1996 Aug 5-7 |
57 |
38 |
1 |
4 |
|
(NA) 1996 Apr 9-10 |
55 |
38 |
0 |
7 |
|
(NA) 1995 Apr 17-19 |
51 |
43 |
* |
6 |
|
(RV) 1992 Jul 6-8 |
54 |
38 |
* |
8 |
|
(vol.) Volunteered response |
||||
|
* Less than 0.5% |
||||
|
(RV) Registered Voters |
||||
|
(NA) National Adults |
||||
Which do you think would be best for the investment climate in the United States: 1) If the REPUBLICANS won majority control of both the House and the Senate, 2) If the DEMOCRATS won majority control of both the House and the Senate, OR 3) If one party wins majority control of the House and the OTHER PARTY wins majority control of the Senate [READ AND ROTATE 1-3]?
|
If the REPUBLICANS won majority |
If the DEMOCRATS |
If one party |
|
|
|
2002 Oct |
39% |
30 |
23 |
8 |
Do you think the investment climate in the United States will, or will not, be affected by the results of the congressional elections?
Do you think the investment climate will be affected a great deal, a moderate amount, or only a little?
|
A great |
A moderate amount |
Only |
Not at all |
No opinion |
|
|
2002 Oct |
14% |
42 |
12 |
29 |
3 |
Do you approve or disapprove of the way Congress is handling its job?
|
Approve |
Disapprove |
No opinion |
|
|
% |
% |
% |
|
|
2002 |
|||
|
2002 Oct 3-6 |
50 |
40 |
10 |
|
2002 Sep 5-8 |
52 |
40 |
8 |
|
2002 Aug 5-8 |
46 |
43 |
11 |
|
2002 Jul 26-28 |
53 |
36 |
11 |
|
2002 Jul 9-11 |
54 |
36 |
10 |
|
2002 Jun 3-6 |
52 |
38 |
10 |
|
2002 May 6-9 |
57 |
33 |
10 |
|
2002 Apr 8-11 |
57 |
34 |
9 |
|
2002 Mar 4-7 |
63 |
28 |
9 |
|
2002 Feb 4-6 |
62 |
28 |
10 |
|
2002 Jan 7-9 |
62 |
29 |
9 |
|
2001 |
|||
|
2001 Dec 6-9 |
72 |
19 |
9 |
|
2001 Nov 8-11 |
73 |
19 |
8 |
|
2001 Oct 11-14 |
84 |
10 |
6 |
|
2001 Sep 7-10 |
42 |
44 |
14 |
|
2001 Aug 16-19 |
50 |
37 |
13 |
|
2001 Aug 3-5 |
47 |
42 |
11 |
|
2001 Jul 19-22 |
49 |
37 |
14 |
|
2001 Jun 11-17 |
51 |
34 |
15 |
|
2001 May 10-14 |
49 |
34 |
17 |
|
2001 Apr 6-8 |
55 |
32 |
13 |
|
2001 Mar 5-7 |
55 |
28 |
17 |
|
2001 Feb 1-4 |
53 |
32 |
15 |
|
2001 Jan 10-14 |
50 |
40 |
10 |
|
2000 |
|||
|
2000 Dec 2-4 |
56 |
34 |
10 |
|
2000 Oct 6-9 |
49 |
42 |
9 |
|
2000 Aug 29-Sep 5 |
48 |
42 |
10 |
|
2000 May 18-21 |
39 |
52 |
9 |
|
2000 Jan 7-10 |
51 |
42 |
7 |
|
1999 |
|||
|
1999 Sep 23-26 |
37 |
56 |
7 |
|
1999 Jul 13-14 |
39 |
51 |
10 |
|
1999 Jun 11-13 |
41 |
53 |
6 |
|
1999 Apr 13-14 |
45 |
47 |
8 |
|
1999 Feb 12-13 |
41 |
54 |
5 |
|
1999 Jan 15-17 |
50 |
46 |
4 |
|
1998 |
|||
|
1998 Dec 15-16 |
42 |
52 |
6 |
|
1998 Nov 13-15 |
41 |
54 |
5 |
|
1998 Oct 29-Nov 1 |
44 |
47 |
9 |
|
1998 Oct 9-12 |
47 |
46 |
7 |
|
1998 Oct 6-7 |
44 |
48 |
8 |
|
1998 Sep 11-12 |
55 |
36 |
9 |
|
1998 May 8-10 |
44 |
48 |
8 |
|
1998 Apr 17-19 |
49 |
40 |
11 |
|
1998 Feb 13-15 |
57 |
33 |
10 |
|
1998 Jan 30-Feb 1 |
56 |
35 |
9 |
|
1998 Jan 16-18 |
42 |
47 |
11 |
|
1997 |
|||
|
1997 Dec 18-21 |
39 |
52 |
9 |
|
1997 Oct 27-29 |
36 |
53 |
11 |
|
1997 Aug 22-25 |
41 |
48 |
11 |
|
1997 Jul 25-27 |
34 |
57 |
9 |
|
1997 May 6-7 |
32 |
58 |
10 |
|
1997 Apr 18-20 |
30 |
59 |
11 |
|
1997 Feb 24-26 |
37 |
48 |
15 |
|
1997 Jan 31-Feb 2 |
36 |
51 |
13 |
|
1997 Jan 10-13 |
41 |
49 |
10 |
|
1996 |
|||
|
1996 Oct 26-29 |
34 |
51 |
15 |
|
1996 Aug 5-7 |
39 |
49 |
12 |
|
1996 May 9-12 |
30 |
65 |
5 |
|
1996 Apr 9-10 |
35 |
57 |
8 |
|
1995 |
|||
|
1995 Sep 22-24 |
30 |
61 |
9 |
|
1995 Aug 28-30 |
30 |
60 |
10 |
|
1995 Jul 7-9 |
35 |
55 |
10 |
|
1995 May 11-14 |
34 |
57 |
9 |
|
1995 Apr 17-19 |
37 |
54 |
9 |
|
1995 Mar 27-29 |
31 |
61 |
8 |
|
1995 Mar 17-19 |
32 |
59 |
9 |
|
1995 Feb 24-26 |
35 |
53 |
12 |
|
1995 Feb 3-5 |
38 |
53 |
9 |
|
1995 Jan 16-18 |
33 |
52 |
15 |
|
1994 |
|||
|
1994 Dec 28-30 |
23 |
66 |
11 |
|
1994 Oct 22-25 |
23 |
70 |
7 |
|
1994 Oct 7-9 |
21 |
73 |
6 |
|
1994 Jul 15-17 |
27 |
65 |
8 |
|
1994 Mar 25-27 |
29 |
63 |
8 |
|
1994 Feb 26-28 |
28 |
66 |
6 |
|
1993 |
|||
|
1993 Nov 2-4 |
24 |
69 |
8 |
|
1993 Aug 8-10 |
23 |
69 |
8 |
|
1993 Jul 19-21 |
24 |
65 |
11 |
|
1993 Feb 26-28 |
27 |
54 |
19 |
|
1992 |
|||
|
1992 Mar 3 ^ |
18 |
78 |
3 |
|
1991 |
|||
|
1991 Oct 10-13 |
40 |
54 |
6 |
|
1991 Jul 25-28 |
32 |
53 |
15 |
|
1990 |
|||
|
1990 Nov 2-4 |
26 |
63 |
11 |
|
1990 Oct 25-28 |
24 |
68 |
8 |
|
1990 Oct 18-21 |
23 |
64 |
13 |
|
1990 Oct 11-14 |
28 |
65 |
7 |
|
1988 |
|||
|
1988 Sep 9-11 |
42 |
42 |
16 |
|
1987 |
|||
|
1987 Aug 24-Sep 2 |
42 |
49 |
9 |
|
1986 |
|||
|
1986 Apr 11-14 |
42 |
37 |
21 |
|
1983 |
|||
|
1983 Apr 29-May 2 |
33 |
43 |
24 |
|
1982 |
|||
|
1982 Jun 11-14 |
29 |
54 |
17 |
|
1981 |
|||
|
1981 Jun 19-22 |
38 |
40 |
22 |
|
1980 |
|||
|
1980 Jun 13-16 |
25 |
56 |
19 |
|
1979 |
|||
|
1979 Jun 1-4 |
19 |
61 |
20 |
|
1978 |
|||
|
1978 Sep 8-11 |
29 |
49 |
22 |
|
1977 |
|||
|
1977 Sep 9-12 |
35 |
44 |
21 |
|
1977 Aug 5-8 |
36 |
44 |
20 |
|
1977 Jun 3-6 |
34 |
42 |
24 |
|
1977 May 20-23 |
40 |
40 |
20 |
|
1977 Mar 25-28 |
36 |
42 |
22 |
|
1976 |
|||
|
1976 Jan 23-26 |
24 |
58 |
18 |
|
1975 |
|||
|
1975 Oct 31-Nov 3 |
28 |
54 |
18 |
|
1975 Jun 27-30 |
29 |
54 |
17 |
|
1975 Apr 18-21 |
38 |
48 |
14 |
|
1975 Feb 28-Mar 3 |
32 |
50 |
18 |
|
1974 |
|||
|
1974 Oct 11-14 |
35 |
43 |
22 |
|
1974 Aug 16-19 |
30 |
47 |
23 |
|
1974 Apr 12-15 |
30 |
47 |
23 |
