GALLUP NEWS SERVICE
PRINCETON, NJ -- In an official proclamation on the first Veterans Day, President Dwight D. Eisenhower wrote:
Now, Therefore, I, Dwight D. Eisenhower, President of theUnited States of America, do hereby call upon all of our citizens to observe Thursday, November 11, 1954, as Veterans Day. On that day let us solemnly remember the sacrifices of all those who fought so valiantly, on the seas, in the air, and on foreign shores, to preserve our heritage of freedom, and let us reconsecrate ourselves to the task of promoting an enduring peace so that their efforts shall not have been in vain. -- Oct. 8, 1954
Do American veterans feel appropriately honored? The answer is a resounding "yes," according to a 2001 Gallup Poll. Nearly three-quarters (73%) of veterans say they have "received the respect and thanks [they] deserve for serving in the armed forces." Veterans' satisfaction with the recognition they have received is seen across all major age groups, including those of the right age to have served during Vietnam.
There are also clear indications that Americans hold the military, in general, in very high esteem. Gallup's annual measurement of public confidence in institutions consistently finds the military to be the top-rated institution among Americans, exceeding "the church or organized religion," the police, the Supreme Court, and the presidency, among a dozen or so other institutions. Prior to 1986, religious institutions held the top spot, with the military generally ranking second. Since Gallup established this question in 1973, the average level of high public confidence in the military has been around 65%. Since Sept. 11, Gallup has seen a sharp increase in public confidence in the military; its ratings have jumped more than 10 points to 79% in the latest poll, conducted in June.
What Does the Veteran Population Look Like Today?
Almost 50 years after Veterans Day was established as a national holiday in 1954, one-third of the Americans it honors remain those recognized at the beginning -- uniformed servants of World War I (1914-18), World War II (1939-45), or the Korean conflict (1950-53). The period of service with the largest number of living veterans today is the Vietnam era (1959-1975). Since Vietnam, a substantial number has been added to the rolls, including those serving in peacetime after Vietnam, and those serving in the 1991 Gulf War.
|
VETERAN FACTS |
||
|
Number of Living Veterans |
Percentage of All Veterans |
|
|
World War I |
600 |
Less than 0.5% |
|
World War II |
5,152,300 |
20 |
|
Korean conflict |
3,338,500 |
13 |
|
Vietnam era |
10,740,600 |
43 |
|
Post-Vietnam (including Gulf War) |
6,117,000 |
24 |
|
TOTAL |
25,349,000 |
100% |
|
Data source: Department of Veterans Affairs, Sept. 2001 |
||
|
Totals include peacetime veterans during each era |
||
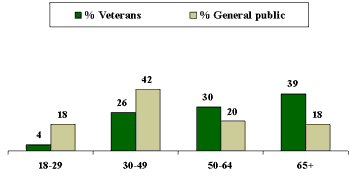
In accordance with these facts, a Gallup Poll conducted May 20-21, 2001 found that, of the 16% of Americans calling themselves veterans of the armed forces, roughly two-thirds are aged 50 or older. This is markedly older than the general population.
| Age of Veterans Compared to U.S. Public |
 |
| May, 20-21 2001 |
(In that three-quarters of all living veterans served during Vietnam or earlier, and that the youngest a Vietnam War-era veteran could be today is 45 -- if he or she joined the service at 18 in the final year of the war -- it is logical that three-quarters of veterans should be 45 years or older. In fact, that is exactly what Gallup finds. Seventy-four percent of respondents who tell Gallup they have been in the armed forces are 45 or older.)
An even more distinguishing feature of the veteran population, although not a surprising one, is that it is overwhelmingly male. Nine in 10 veterans polled by Gallup are male, whereas the U.S. adult population breaks 48% male, 52% female.
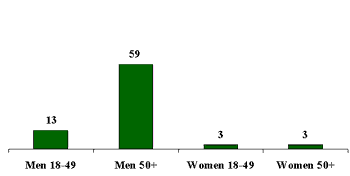
Another way to look at the age and gender aspects of being a veteran is that 6 out of 10 men aged 50 and older have served in the armed forces, compared to only 13% of men aged 18-49, and 3% of women in both age groups.
| Percentage of Veterans by Gender/Age |
 |
| May, 20-21 2001 |
Veterans are similar to the general population in several respects: their racial makeup, their income and educational attainment, and their geographic dispersion across the country. In terms of their self-described political ideology and their party preferences, veterans tend toward the political right. For instance, 41% of veterans describe their political views as conservative, compared to 34% of the public at large. At the time of this survey, in May 2001, one-third of veterans were oriented toward the Republican Party, compared to 29% of the general public.
|
Political Orientation of Veterans |
||
|
General Public |
Veterans |
|
|
% |
% |
|
|
Conservative |
34 |
41 |
|
Moderate |
42 |
43 |
|
Liberal |
20 |
14 |
|
Republican |
29 |
34 |
|
Independent |
38 |
36 |
|
Democrat |
33 |
30 |
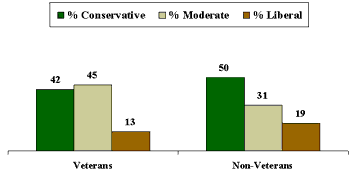
The reason veterans hold more conservative-than-average views is not clear. While it could be due to the experience of serving in the military, the findings among older Americans suggest otherwise. Overall, older men (those 50 and older) tend to be more conservative than younger men. But just looking at men aged 50 and older, veterans actually tend to be less conservative than do non-veterans.
| Political Orientation of Men Aged 50 or
Older by Veteran Status |
 |
| May, 20-21 2001 |
Survey Methods
These results are based on telephone interviews with a randomly selected national sample of 1,011 adults, 18 years and older, conducted May 18-20, 2001. For results based on this sample, one can say with 95 percent confidence that the maximum error attributable to sampling and other random effects is plus or minus 3 percentage points. In addition to sampling error, question wording and practical difficulties in conducting surveys can introduce error or bias into the findings of public opinion polls.
Are you personally a veteran of the armed forces?
|
Yes |
No |
No opinion |
|
|
2001 May 18-20 |
16% |
84 |
* |
|
* Less than 0.5% |
|||
|
Demographic Profile of Veterans vs. the Public |
||
|
May 2001 |
||
|
National Adults |
Veterans |
|
|
% |
% |
|
|
Male |
48 |
90 |
|
Female |
52 |
10 |
|
White |
83 |
89 |
|
Total Nonwhite |
16 |
11 |
|
Black |
11 |
7 |
|
18-29 |
18 |
4 |
|
30-49 |
42 |
26 |
|
50-64 |
20 |
30 |
|
65+ |
18 |
39 |
|
East |
23 |
21 |
|
Midwest |
24 |
25 |
|
South |
32 |
34 |
|
West |
22 |
20 |
|
Postgraduate education |
13 |
17 |
|
College grad only |
13 |
8 |
|
Some college |
32 |
35 |
|
High School or less |
41 |
39 |
|
$50,000+ |
40 |
44 |
|
$30,000-49,999 |
22 |
27 |
|
$20,000-29,999 |
13 |
13 |
|
Less than $20,000 |
19 |
12 |
|
Conservative |
34 |
41 |
|
Moderate |
42 |
43 |
|
Liberal |
20 |
14 |
|
Republican |
29 |
34 |
|
Independent |
38 |
36 |
|
Democrat |
33 |
30 |
Would you say you have or have not received the respect and thanks you deserve for serving in the Armed Forces?
BASED ON -- 169 -- VETERANS OF ARMED FORCES; ±8 PCT. PT.S
|
Yes, have received |
No, not |
No opinion |
|
|
2001 May 18-20 |
73% |
24 |
3 |
Now I am going to read you a list of institutions in American society. Please tell me how much confidence you, yourself, have in each one -- a great deal, quite a lot, some, or very little? First, ... Next, [RANDOM ORDER]
|
TOP FIVE INSTITUTIONS IN 2002 |
|||||
|
% "Great deal" or "Quite a lot" of confidence |
|||||
|
The Military |
The Police |
The Presidency |
The U.S. Supreme Court |
Banks |
|
|
% |
% |
% |
% |
% |
|
|
2002 Jun 21-23 |
79 |
59 |
58 |
50 |
47 |
|
2001 Jun |
66 |
57 |
48 |
50 |
44 |
|
2000 Jun |
64 |
54 |
42 |
47 |
46 |
|
1999 Jun |
68 |
57 |
49 |
49 |
43 |
|
1998 Jun |
64 |
58 |
53 |
50 |
40 |
|
1997 Jul |
60 |
59 |
49 |
50 |
41 |
|
1996 May |
66 |
60 |
39 |
45 |
44 |
|
1995 Apr |
64 |
58 |
45 |
44 |
43 |
|
1994 Mar |
64 |
54 |
38 |
42 |
35 |
|
1993 Mar |
68 |
52 |
43 |
44 |
37 |
|
1991 Oct |
69 |
-- |
50 |
39 |
30 |
|
1991 Mar |
85 |
-- |
72 |
48 |
32 |
|
1990 Aug |
68 |
-- |
-- |
47 |
36 |
|
1989 Sep |
63 |
-- |
-- |
46 |
42 |
|
1988 Sep |
68 |
-- |
-- |
56 |
49 |
|
1987 Jul |
61 |
-- |
-- |
52 |
51 |
|
1986 Jul |
63 |
-- |
-- |
54 |
49 |
|
1985 May |
61 |
-- |
-- |
56 |
51 |
|
1984 Oct |
58 |
-- |
-- |
51 |
51 |
|
1983 Aug |
53 |
-- |
-- |
42 |
51 |
|
1981 Nov |
50 |
-- |
-- |
46 |
46 |
|
1979 Apr |
54 |
-- |
-- |
45 |
60 |
|
1977 Jan |
57 |
-- |
-- |
46 |
-- |
|
1975 May |
58 |
-- |
-- |
49 |
-- |
|
1973 May |
-- |
-- |
-- |
44 |
-- |
|
Average |
64 |
57 |
49 |
48 |
44 |
|
-- Not asked |
|||||