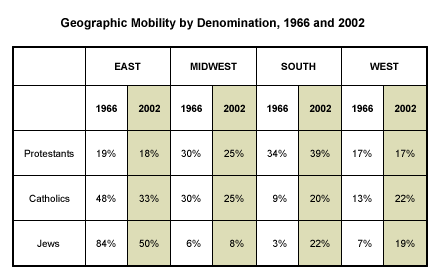
A comparison of Gallup survey data* from the 1960s and 2002 reveals that the proportions of self-described Protestants have remained stable in all four U.S. regions, but that the percentages of Catholics and Jews in the various regions have changed dramatically. The percentage of U.S. Catholics who live in the South has more than doubled since 1966 (from 9% to 20%), and the percentage of the nation's Jews living in the South has increased seven times (from 3% to 22%) in that time. In 1966, 84% of American Jews lived in the East, while today only 50% of American Jews reside in the East.

Many Catholics and Jews appear to have migrated to the South and West from the East**. This reflects the general population migration trend of recent decades in which far more people have moved from North to South than in the opposite direction, possibly attracted by warmer weather and growing metropolitan areas in the South and Southwest.
General trends in the country's four regions include the following:
- The percentage of the country's Protestants living in the East has remained fairly stable, while the proportions of Catholics and Jews who live there have declined.
- The percentage of Protestants and Catholics living in the Midwest has dropped also, but the percentage of Jews living there has increased slightly.
- There has been some movement of Protestants to the South, as well as substantial increases in the proportions of Catholics and Jews in that area.
- In the West, the percentage of the nation's Protestants is the same today as in 1966, but the percentage of Jews and Catholics has climbed steeply.
National Variation by Denomination Since 1966
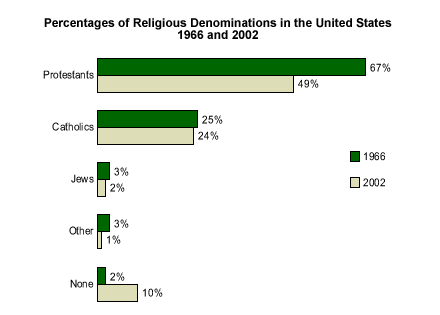
On a national basis, the self-reported populations of Catholics and Jews have remained relatively stable since 1966. When asked to identify their religious preference, 24% of all respondents answer Catholicism, and Judaism is mentioned by 2% of the populace. But the number of Americans identifying themselves as Protestant has declined by 18 percentage points in the last 36 years -- from 67% in 1966 to 49% in 2002. This drop reflects the fact that the percentage of people naming other religious groups has risen -- and that the percentage of people who respond with "none" when questioned about their religious preference has increased from 2% in 1966 to 10% today.

Immigration from predominantly Catholic Latin American countries has risen in the last three decades, swelling 47% between 1990 and 2000 alone. That undoubtedly has contributed to the stability of the percentage of Catholics in the United States -- in fact, it is somewhat surprising that despite the huge influx of Hispanic immigrants, the percentage of Catholics in the United States has remained steady rather than increased. With the 2002 Gallup Index of Leading Religious Indicators revealing a crisis in confidence for the Catholic Church (see Related Items), the number of Americans claiming Catholic affiliation will bear watching in the near future.
Although the percentage of self-identified Jews in the United States is statistically unchanged since 1966, the actual number of American Jews has long been debated. According to a 2000 population survey for the American Jewish Committee, those numbers are declining: "In the United States, the Jewish population will drop from 5.7 million in 2000 to 5.6 million in 2020, to 4.7 million in 2050 and 3.8 million in 2080." In Gallup surveys, the percentage of respondents giving their religious preference as Jewish was 3% in 1966 and 2% in 2002.
*The 2002 Index was compiled from surveys of national adults, aged 18 and older, conducted throughout the year. The findings from 1966 are based on interviews with 41,134 national adults, aged 18 and older, conducted throughout 1966.
**Gallup identifies these states as "East": Maine, New Hampshire, Vermont, Massachusetts, Rhode Island, Connecticut, New York, New Jersey, Pennsylvania, Maryland, Delaware, West Virginia, and the District of Columbia
Gallup identifies these states as "West": Montana, Arizona, Colorado, Idaho, Wyoming, Utah, Nevada, New Mexico, California, Oregon, and Washington
Gallup identifies these states as "South": Virginia, North Carolina, South Carolina, Georgia, Florida, Kentucky, Tennessee, Alabama, Mississippi, Arkansas, Louisiana, Oklahoma, and Texas
Gallup identifies these states as "Midwest": Ohio, Michigan, Indiana, Illinois, Wisconsin, Minnesota, Iowa, Missouri, North Dakota, South Dakota, Nebraska, and Kansas
