GALLUP NEWS SERVICE
PRINCETON, NJ -- Public support for an invasion of Iraq has been in the mid-50% range since talk of U.S. military action against Iraq intensified last summer. An analysis of data from six Gallup Polls conducted in December and January shows that support is highest among Republicans, conservatives, younger Americans, and those with a high school education or less. A majority of blacks, Democrats, liberals, and those with a postgraduate education oppose an invasion. Men are slightly more likely than women to favor U.S. action against Iraq.
Since June 2002, Gallup has asked Americans whether they "favor or oppose invading Iraq with U.S. ground troops in an attempt to remove Saddam Hussein from power." Support has been relatively consistent, ranging from a low of 52% to a high of 59%, over the course of those seven months.
| Public Support for Invading Iraq June 2002 - January 2003 |
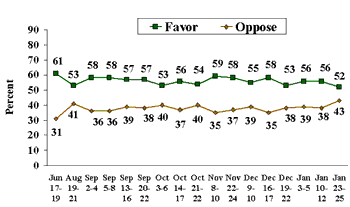 |
In December and January, support has averaged 55% and opposition 39%. The combined data from the last two months (totaling 4,482 interviews) reveal key differences by demographic group.
Gender
Historically, men are much more supportive of military action than women are. This is evident in polling Gallup has conducted on the Vietnam War, the Persian Gulf War, and the Korean War. Men and women differ in their support for an invasion of Iraq, but the differences are not dramatic. The data show support levels at 59% among men, and 51% among women.
| Support for U.S. Invasion of Iraq By Gender |
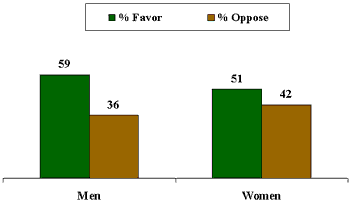 |
| December 2002 – January 2003 |
Race
As on many issues in American politics, a racial divide is evident on opinions about the situation in Iraq. A majority of whites, 58%, favor of an invasion of Iraq -- much higher than the 37% of blacks who favor an invasion. A majority of blacks, 56%, oppose an invasion. Sixty percent of Hispanics favor an invasion, while 33% are opposed.
| Support for U.S. Invasion of Iraq By Race and Ethnicity |
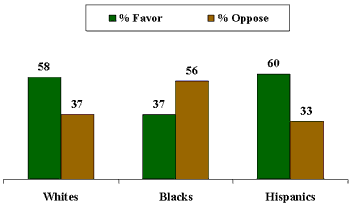 |
| December 2002 – January 2003 |
Age
Younger Americans are significantly more likely to support military action against Iraq than are older Americans. The data show that 61% of those between the ages of 18 and 29 support an invasion. Support is somewhat lower among those between the ages of 30 and 49 (58%) and those aged 50 to 64 (54%). But only 44% of those aged 65 and older are in favor of a U.S. invasion of Iraq, while 46% are opposed.
| Support for U.S. Invasion of Iraq By Age |
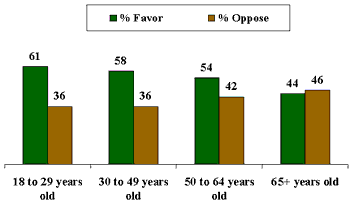 |
| December 2002 – January 2003 |
Education
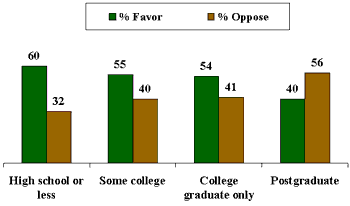
There are rather large differences by educational background, with support lowest among the most highly educated. Among those with a postgraduate education, just 40% support an invasion (while 56% of this education group is opposed). Support jumps to 54% among those with a college degree (but no postgraduate education) and those with some college education (55%). But 6 in 10 Americans with a high school education or less support an invasion of Iraq. Despite these education-related differences, there are no differences by household income.
| Support for U.S. Invasion of Iraq By Education |
 |
| December 2002 – January 2003 |
Partisanship and Ideology
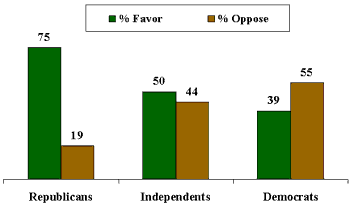
Not surprisingly, some of the largest differences are seen by partisanship and ideology. Seventy-five percent of Republicans favor an invasion, compared with 50% of independents and 39% of Democrats.
| Support for U.S. Invasion of Iraq By Partisanship |
 |
| December 2002 – January 2003 |
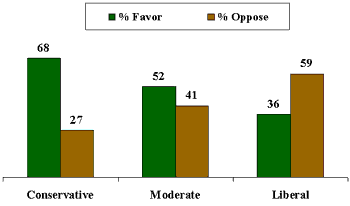
Sixty-eight percent of self-described conservatives support an invasion, compared with 52% of moderates and 36% of liberals.
A majority of both liberals (59%) and Democrats (55%) oppose a U.S. invasion of Iraq.
| Support for U.S. Invasion of Iraq By Ideology |
 |
| December 2002 – January 2003 |
Because partisanship is related to an individual's demographic characteristics such as race, gender, education, and age, this might suggest that the observed differences here are simply a function of partisanship. That is, blacks and postgraduates may oppose an invasion because people in these groups tend to identify as Democrats, who overwhelmingly oppose an invasion. However, a separate analysis of these data shows that the demographic differences still exist when partisanship is taken into account.
Survey Methods
These results are based on telephone interviews with six randomly selected national samples of adults, aged 18 and older, conducted in December 2002 and January 2003. For results based on this sample of 4,482 adults, one can say with 95% confidence that the maximum error attributable to sampling and other random effects is ±2 percentage points. In addition to sampling error, question wording and practical difficulties in conducting surveys can introduce error or bias into the findings of public opinion polls.
Support for U.S. Invasion of Iraq, by Subgroup
|
Group |
% Favor |
% Oppose |
Sample Size |
|
Republican |
75 |
19 |
1,542 |
|
Conservative ideology |
68 |
27 |
1,699 |
|
18 to 29 years old |
61 |
36 |
655 |
|
Hispanic |
60 |
33 |
266 |
|
High school education or less |
60 |
32 |
1,466 |
|
Men |
59 |
36 |
2,129 |
|
White (non-Hispanic) |
58 |
37 |
3,645 |
|
30 to 49 years old |
58 |
36 |
1,785 |
|
Household income $75,000 or greater |
56 |
40 |
1,202 |
|
Some college education (incomplete) |
55 |
40 |
1,222 |
|
Household income less than $30,000 |
55 |
38 |
1,245 |
|
Household income $30,000 to $74,999 |
55 |
40 |
1,757 |
|
50 to 64 years old |
54 |
42 |
1,129 |
|
College graduate (no postgraduate ed) |
54 |
41 |
848 |
|
Moderate ideology |
52 |
41 |
1,879 |
|
Women |
51 |
42 |
2,353 |
|
Independent |
50 |
44 |
1,580 |
|
65 years old and older |
44 |
46 |
845 |
|
Postgraduate education |
40 |
56 |
933 |
|
Democrat |
39 |
55 |
1,341 |
|
Black |
37 |
56 |
352 |
|
Liberal ideology |
36 |
59 |
878 |
