GALLUP NEWS SERVICE
PRINCETON, NJ -- The economy has clearly taken over in the minds of Americans as the most important problem facing the country, a sentiment shared by Republicans, independents, and Democrats alike. A little more than half of Americans mention some aspect of economic concerns when asked to name the most important problem, significantly eclipsing mentions of terrorism or war, and also more than mentions of such traditional domestic concerns as healthcare, education, and Social Security. Additionally, 54% of Americans say they are satisfied with the say things are going in the United States -- significantly higher than was the case earlier this year, reflecting the rally in the public's mood that began as the war with Iraq got underway in mid-March.
Most Important Problem
Since the 1930s, Gallup has been asking Americans to name -- top of mind, without prompting -- the most important problem facing this country today. Responses almost always can be grouped into three broad categories: 1) economic concerns, 2) international issues, including wars, and 3) domestic concerns.
War, the Cold War, or international tensions were predominately on the public's mind throughout such periods as the 1950s and early 1960s, and the Vietnam era extending from the late 1960s into the 1970s. Economic issues were particularly likely to be cited as the most important problem in the late 1970s and early 1980s, and in the early 1990s. Domestic concerns such as race relations (mid-1960s), the environment (late 1970s), crime (mid-1990s), and drugs (1989) have also been high on the "most important" list from time to time, usually reflecting intense media focus on particular issues for relatively short periods of time.
Over the last decade, there have been particularly large changes in the public's perception of the economy as the top problem facing the country. High on the public's list in the early 1990s, economic concerns faded during the boom years in the late 1990s, but were beginning to increase again by late summer 2001. Then came the terrorist attacks of Sept. 11, 2001, and concerns about terrorism and international issues quickly became the public's perceived top problems. Beginning last fall, concerns about the war with Iraq were mentioned with more and more frequency, culminating in 35% mentions of war as the top problem in February of this year.
Now, Americans' spontaneous mentions of either war or terrorism as the top problem have fallen precipitously. Only 8% mention terrorism (the lowest since 9-11) and 7% mention war (the lowest since last August).
And worries about the economy have returned as the dominant concerns of Americans when asked this "most important problem" question -- as noted, mentioned in one way or the other by half of those interviewed in Gallup's most recent poll, conducted May 5-7. No other single category of perceived problem comes close to the 33% mention the general economy receives as the top problem or the 15% mention for unemployment or jobs. In addition to the 8% who mention terrorism and the 7% who mention war, 7% of the public mentions each of three domestic categories: education, healthcare, and dissatisfaction with government, and 6% mention ethics and declining morals.
|
What do you think is the most important problem facing this country today? |
||
|
May |
||
|
% |
||
|
ECONOMIC PROBLEMS (NET) |
52 |
|
|
1 |
Economy in general |
33 |
|
2 |
Unemployment/ jobs |
15 |
|
3 |
Taxes |
3 |
|
4 |
Federal budget deficit/ federal debt |
3 |
|
5 |
Lack of money |
1 |
|
6 |
High cost of living/inflation |
1 |
|
7 |
Fuel/ Oil prices |
1 |
|
8 |
Wage issues |
1 |
|
9 |
Gap between rich and poor |
* |
|
10 |
Corporate corruption |
* |
|
Recession |
-- |
|
|
NON-ECONOMIC PROBLEMS (NET) |
58 |
|
|
1 |
Terrorism |
8 |
|
2 |
Education/ poor education/ access to education |
7 |
|
3 |
Poor healthcare/ hospitals; high cost of healthcare |
7 |
|
4 |
Fear of war/ feelings of fear in this country/ war in Iraq |
7 |
|
5 |
Dissatisfaction with government/ Congress/ politicians/ candidates; Poor leadership; corruption |
7 |
|
6 |
Ethics/ moral/ religious/ family decline; dishonesty; lack of integrity |
6 |
|
7 |
National security |
4 |
|
8 |
Poverty/ hunger/ homelessness |
3 |
|
9 |
Crime/ violence |
3 |
|
10 |
Medicare/ Social Security issues |
3 |
|
11 |
Lack of respect for each other |
2 |
|
12 |
Foreign aid/ focus overseas |
2 |
|
13 |
Drugs |
2 |
|
14 |
Immigration/ illegal aliens |
2 |
|
15 |
Unifying the country |
1 |
|
16 |
International issues/ problems |
1 |
|
17 |
Judicial system/ courts/ laws |
1 |
|
18 |
Children's behavior/ way they are raised |
1 |
|
19 |
Race relations/ racism |
1 |
|
20 |
Care for the elderly |
1 |
|
21 |
Abuse of power |
1 |
|
22 |
Environment/ pollution |
1 |
|
23 |
Welfare |
1 |
|
24 |
Election year/ presidential choices/ election reform |
* |
|
25 |
Child abuse |
* |
|
26 |
Abortion |
* |
|
27 |
Lack of energy sources; the energy crisis |
* |
|
28 |
Lack of military defense |
* |
|
29 |
The media |
* |
|
Guns/ gun control |
-- |
|
|
School shootings/ school violence |
-- |
|
|
Overpopulation |
-- |
|
|
AIDS |
-- |
|
|
Space shuttle disaster/ NASA |
-- |
|
|
Other non-economic |
4 |
|
|
No opinion |
3 |
|
|
Total |
137% |
|
|
* |
Less than 0.5% |
|
Partisan Differences
Republicans, independents, and Democrats all view the economy
and Unemployment/
jobs as the top problems facing the country.
Beyond that, Republicans are generally more concerned about terrorism, ethics/morality, and national security than are independents and Democrats.
Democrats are somewhat more likely than independents and Republicans to mention domestic concerns such as education, healthcare, and poverty.
|
Most Important Problem Facing Country Today |
|||||
|
Republicans |
Democrats |
Independents |
|||
|
Economy (general) |
34% |
Economy (general) |
30% |
Economy (general) |
33% |
|
Unemployment/ |
12 |
Unemployment/ |
20 |
Unemployment/ |
14 |
|
Terrorism |
12 |
Education |
7 |
Terrorism |
8 |
|
Ethical/ Moral/ Religious decline |
7 |
Poor healthcare/ hospitals |
7 |
Education |
6 |
|
National security |
7 |
Fear of war |
6 |
Government/ Congress/ politicians |
6 |
|
Poor healthcare/ hospitals |
5 |
Poverty/ hunger/ homelessness |
6 |
Fear of war |
6 |
|
Education |
5 |
Terrorism |
5 |
Federal budget deficit |
3 |
|
Taxes |
4 |
Government/ Congress/ politicians |
4 |
Poor healthcare/ hospitals |
3 |
|
Government/ Congress/ politicians |
4 |
Crime/violence |
4 |
Ethical/ moral/ religious decline |
3 |
|
Crime/violence |
3 |
||||
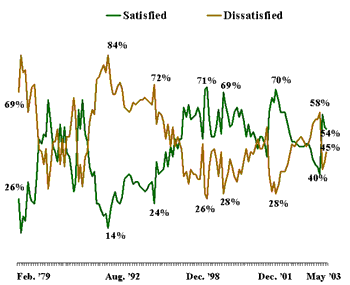
Satisfaction With the Way Things Are Going in the United States
A little more than half of Americans say they are satisfied with the way things are going in the United States. This measure is often used as a fundamental yardstick for the public's mood.
Gallup has been asking the question in the present format ("In general, are you satisfied or dissatisfied with the way things are going in the United States at this time?") since 1979. The low points in satisfaction came in July 1979 (12%) and June 1992 (14%). The high points were measured in 1986, when 69% of Americans said they were satisfied; in late February/early March 1991, just after the Persian Gulf War victory, when 66% were satisfied; in January and February 1999, when 70% and 71%, respectively, were satisfied in the midst of the economic boom (and as the fate of Bill Clinton was being decided as the United States Senate voted on charges of impeachment); and in December 2001, when 70% were satisfied, as the public rebounded from the terrorist attacks of Sept. 11 and responded favorably to the apparent success of the military response to terrorism in Afghanistan.
By last year, however, satisfaction began to slip below the 50% mark, dropping to a low of 36% in early March of this year, as perceptions about the economy became more negative and as the continued debate about possible war against Iraq wore on.
Since the war with Iraq began, satisfaction with the way things are going has climbed above the 50% mark, and remained there across three measures. Our May 5-7 poll puts satisfaction at 54%.
| Satisfaction With the Way Things Are Going in the United States Today |
 |
Who Is Most Satisfied and Who Is Least Satisfied?
Here are the segments of the U.S. population with the highest average satisfaction levels:
|
Republicans |
78% |
|
Conservatives |
68 |
|
Men 18-49 |
66 |
|
Incomes of $50,000-<$75,000 |
64 |
|
18- to 29-year-olds |
63 |
|
Suburban |
58 |
|
South |
58 |
|
Have children under 18 |
58 |
|
Whites |
58 |
Here are the segments with the lowest average satisfaction levels:
|
Democrats |
33% |
|
Liberals |
34 |
|
Nonwhites |
42 |
|
Have postgraduate education |
43 |
|
Men 50+ |
43 |
|
Incomes under $20,000 |
43 |
It's clear that satisfaction has a strong partisan aspect to it. Republicans and conservatives, with a strong and polarizing Republican president in the White House, are most satisfied, while Democrats and liberals are least satisfied.
Younger people are quite satisfied, particularly younger men. This is not necessarily a function of politics; young people aged 18-29 are in fact less likely to be Republicans and more likely to be independents than is the general population.
Traditionally, both those with low incomes and those with postgraduate educations tend to be Democrats, which may help explain their low levels of overall satisfaction.
Does Satisfaction Predict Election Outcomes?
One might think that the level of satisfaction with the way things are going in the United States would be a good predictor of an incumbent president's re-election chances, but the recent data do not necessarily support that hypothesis. Clearly, satisfaction was very low in the periods before Jimmy Carter sought re-election in 1980 and George H.W. Bush sought it in 1992 -- and of course, both lost.
But satisfaction was at only the 48% mark in the fall of 1984, when Ronald Reagan was swept back into office in a landslide over Democratic challenger Walter Mondale, and satisfaction was even lower, at 39%, in the October 1996 Gallup Poll taken days before Bill Clinton handily won re-election over Republican Bob Dole.
Survey Methods
These results are based on telephone interviews with a randomly selected national sample of 1,005 adults, 18 years and older, conducted May 5-7, 2003. For results based on this sample, one can say with 95 percent confidence that the maximum error attributable to sampling and other random effects is ±3 percentage points. In addition to sampling error, question wording and practical difficulties in conducting surveys can introduce error or bias into the findings of public opinion polls.
In general, are you satisfied or dissatisfied with the way things are going in the United States at this time?
|
Satisfied |
Dis- |
No |
|
|
% |
% |
% |
|
|
2003 |
|||
|
2003 May 5-7 |
54 |
45 |
1 |
|
2003 Apr 7-9 |
55 |
41 |
4 |
|
2003 Mar 22-23 |
60 |
38 |
2 |
|
2003 Mar 3-5 |
36 |
61 |
3 |
|
2003 Feb 17-19 |
39 |
58 |
3 |
|
2003 Feb 3-6 |
40 |
58 |
2 |
|
2003 Jan 13-16 |
42 |
56 |
2 |
|
2002 |
|||
|
2002 Dec 5-8 |
46 |
51 |
3 |
|
2002 Nov 11-14 |
48 |
48 |
4 |
|
2002 Oct 31-Nov 3 |
48 |
47 |
5 |
|
2002 Oct 3-6 |
47 |
49 |
4 |
|
2002 Sep 5-8 |
47 |
51 |
2 |
|
2002 Aug 5-8 |
47 |
50 |
3 |
|
2002 Jul 26-28 |
48 |
49 |
3 |
|
2002 Jul 22-24 |
49 |
47 |
4 |
|
2002 Jul 9-11 |
49 |
48 |
3 |
|
2002 Jun 3-6 |
52 |
44 |
4 |
|
2002 May 6-9 |
56 |
40 |
4 |
|
2002 Apr 8-11 |
61 |
37 |
2 |
|
2002 Mar 4-7 |
61 |
37 |
2 |
|
2002 Feb 4-6 |
61 |
37 |
2 |
|
2002 Jan 7-9 |
65 |
32 |
3 |
|
2001 |
|||
|
2001 Dec 6-9 |
70 |
28 |
2 |
|
2001 Nov 8-11 |
65 |
33 |
2 |
|
2001 Oct 11-14 |
67 |
29 |
4 |
|
2001 Sep 14-15 |
61 |
36 |
3 |
|
2001 Sep 7-10 |
43 |
55 |
2 |
|
2001 Aug 16-19 |
48 |
49 |
3 |
|
2001 Jul 19-22 |
51 |
46 |
3 |
|
2001 Jun 11-17 |
51 |
46 |
3 |
|
2001 May 10-14 |
46 |
50 |
4 |
|
2001 Apr 6-8 |
50 |
47 |
3 |
|
2001 Mar 5-7 |
53 |
44 |
3 |
|
2001 Feb 1-4 |
51 |
45 |
4 |
|
2001 Jan 10-14 |
56 |
41 |
3 |
|
2000 |
|||
|
2000 Dec 2-4 |
51 |
46 |
3 |
|
2000 Nov 13-15 |
58 |
41 |
1 |
|
2000 Oct 6-9 |
62 |
36 |
2 |
|
2000 Aug 29-Sep 5 |
59 |
38 |
3 |
|
2000 Aug 18-19 |
63 |
33 |
4 |
|
2000 Jul 14-16 |
61 |
35 |
4 |
|
2000 Jun 22-25 |
56 |
39 |
5 |
|
2000 May 18-21 |
55 |
42 |
3 |
|
2000 Apr 3-9 |
59 |
37 |
4 |
|
2000 Feb 25-27 |
65 |
32 |
3 |
|
2000 Jan 7-10 |
69 |
28 |
3 |
|
Satisfied |
Dis- |
No |
|
|
% |
% |
% |
|
|
1999 |
|||
|
1999 Sep 23-26 |
52 |
45 |
3 |
|
1999 Aug 24-26 |
62 |
35 |
3 |
|
1999 Jun 11-13 |
55 |
42 |
3 |
|
1999 May 23-24 |
51 |
46 |
3 |
|
1999 Apr 26-27 |
51 |
45 |
4 |
|
1999 Apr 13-14 |
58 |
39 |
3 |
|
1999 Feb 12-13 |
71 |
26 |
3 |
|
1999 Jan 15-17 |
70 |
28 |
2 |
|
1998 |
|||
|
1998 Dec 28-29 |
50 |
48 |
2 |
|
1998 Oct 29-Nov 1 |
60 |
34 |
6 |
|
1998 Aug 21-23 |
63 |
34 |
3 |
|
1998 Aug 10-12 |
60 |
36 |
4 |
|
1998 May 8-10 |
59 |
36 |
5 |
|
1998 Apr 17-19 |
58 |
38 |
4 |
|
1998 Feb 20-22 |
64 |
32 |
4 |
|
1998 Feb 13-15 |
59 |
37 |
4 |
|
1998 Jan 30-Feb 1 |
63 |
35 |
2 |
|
1997 |
|||
|
1997 Dec 18-21 |
50 |
46 |
4 |
|
1997 Aug 22-25 |
50 |
48 |
2 |
|
1997 May 6-7 |
46 |
51 |
3 |
|
1997 Jan 10-13 |
50 |
47 |
3 |
|
1996 |
|||
|
1996 Dec 9-11 |
43 |
55 |
2 |
|
1996 Nov 21-24 |
47 |
47 |
6 |
|
1996 Oct 26-29 |
39 |
56 |
5 |
|
1996 Aug 30-Sep 1 |
45 |
50 |
5 |
|
1996 Aug 16-18 |
38 |
57 |
5 |
|
1996 May 9-12 |
37 |
60 |
3 |
|
1996 Mar 15-17 |
36 |
61 |
3 |
|
1996 Mar 8-10 |
41 |
56 |
3 |
|
1996 Jan 5-7 |
24 |
72 |
4 |
|
1995 |
|||
|
1995 Aug 11-14 |
33 |
64 |
3 |
|
1995 Jul 7-9 |
32 |
65 |
3 |
|
1995 Mar 27-29 |
30 |
66 |
4 |
|
Satisfied |
Dis- |
No |
|
|
% |
% |
% |
|
|
1994 |
|||
|
1994 Nov 28-29 |
29 |
67 |
4 |
|
1994 Nov 2-6 |
30 |
66 |
4 |
|
1994 Oct 22-25 |
31 |
66 |
3 |
|
1994 Jul 15-17 |
33 |
65 |
2 |
|
1994 May 20-22 |
33 |
64 |
3 |
|
1994 Apr 22-24 |
32 |
65 |
3 |
|
1994 Mar 25-27 |
35 |
62 |
3 |
|
1994 Feb 26-28 |
36 |
61 |
3 |
|
1994 Jan 15-17 |
35 |
62 |
3 |
|
1993 |
|||
|
1993 Dec 4-6 |
34 |
63 |
3 |
|
1993 Nov 2-4 |
27 |
70 |
3 |
|
1993 May 21-23 |
24 |
73 |
3 |
|
1993 Feb 12-14 |
25 |
71 |
4 |
|
1993 Jan 8-11 |
29 |
68 |
3 |
|
1992 |
|||
|
1992 Nov 11-12 |
26 |
68 |
6 |
|
1992 Aug 28-Sep 2 ‡ |
22 |
73 |
5 |
|
1992 Jul 31-Aug 2 |
17 |
80 |
3 |
|
1992 Jun 12-14 |
14 |
84 |
2 |
|
1992 May 7-10 |
20 |
77 |
3 |
|
1992 Apr 20-22 ^ |
19 |
80 |
1 |
|
1992 Mar 20-22 |
19 |
80 |
1 |
|
1992 Feb 28-Mar 1 |
21 |
78 |
1 |
|
1992 Jan 31-Feb 2 ^ |
24 |
75 |
1 |
|
1992 Jan 3-6 ^ |
24 |
74 |
2 |
|
1991 |
|||
|
1991 Dec 5-8 |
37 |
60 |
3 |
|
1991 Oct 31-Nov 2 |
35 |
62 |
3 |
|
1991 Oct 10-13 |
39 |
57 |
4 |
|
1991 Aug 23-25 |
49 |
45 |
6 |
|
1991 Jul 11-14 |
43 |
50 |
7 |
|
1991 May 23-26 |
49 |
49 |
2 |
|
1991 Mar 21-24 |
52 |
43 |
5 |
|
1991 Feb 28-Mar 3 |
66 |
31 |
3 |
|
1991 Feb 14-17 |
54 |
40 |
6 |
|
1991 Jan 17-21 |
62 |
33 |
5 |
|
1991 Jan 3-6 |
32 |
61 |
7 |
|
1990 |
|||
|
1990 Dec 13-16 |
33 |
64 |
3 |
|
1990 Nov 1-4 |
32 |
64 |
4 |
|
1990 Oct 25-28 |
31 |
66 |
3 |
|
1990 Oct 11-14 |
29 |
67 |
4 |
|
1990 Sep 27-30 |
37 |
58 |
5 |
|
1990 Aug 30-Sep 2 |
51 |
44 |
5 |
|
1990 Aug 9-12 |
43 |
51 |
6 |
|
1990 Jul 19-22 |
45 |
51 |
4 |
|
1990 Feb 8-11 |
55 |
39 |
6 |
|
Satisfied |
Dis- |
No |
|
|
% |
% |
% |
|
|
1989 |
|||
|
1989 May 4-7 |
44 |
50 |
6 |
|
1989 Feb |
45 |
50 |
5 |
|
1988 |
|||
|
1988 Sep 25-Oct 1 |
56 |
40 |
4 |
|
1988 May 13-15 |
41 |
54 |
5 |
|
1987 |
|||
|
1987 Aug 24-Sep 2 |
45 |
49 |
6 |
|
1986 |
|||
|
1986 Dec 4-5 † |
47 |
49 |
4 |
|
1986 Sep 3-17 |
58 |
38 |
4 |
|
1986 Jun 9-16 |
69 |
26 |
5 |
|
1986 Mar 7-10 |
66 |
30 |
4 |
|
1985 |
|||
|
1985 Nov 11-18 |
51 |
46 |
3 |
|
1984 |
|||
|
1984 Dec |
52 |
40 |
8 |
|
1984 Sep 28-Oct 1 |
48 |
45 |
7 |
|
1984 Feb 10-13 |
50 |
46 |
4 |
|
1983 |
|||
|
1983 Aug 5-8 |
35 |
59 |
6 |
|
1982 |
|||
|
1982 Nov 5-8 |
24 |
72 |
4 |
|
1982 Sep 17-20 |
24 |
72 |
4 |
|
1982 Apr 2-5 |
25 |
71 |
4 |
|
1981 |
|||
|
1981 Dec 11-14 |
27 |
67 |
6 |
|
1981 Jun 5-8 |
33 |
61 |
6 |
|
1981 Jan 9-12 |
17 |
78 |
5 |
|
1979 |
|||
|
1979 Nov 2-5 |
19 |
77 |
4 |
|
1979 Jul 13-16 |
12 |
84 |
4 |
|
1979 Feb 2-5 |
26 |
69 |
5 |
What do you think is the most important problem facing this country today? [Open-ended]
|
May |
Apr |
Mar |
Feb |
||
|
% |
% |
% |
% |
||
|
ECONOMIC PROBLEMS (NET) |
52 |
48 |
38 |
46 |
|
|
1 |
Economy in general |
33 |
31 |
29 |
34 |
|
2 |
Unemployment/ |
15 |
11 |
8 |
10 |
|
3 |
Taxes |
3 |
2 |
2 |
2 |
|
4 |
Federal budget deficit/federal debt |
3 |
2 |
1 |
3 |
|
5 |
Lack of money |
1 |
2 |
* |
* |
|
6 |
High cost of living/inflation |
1 |
* |
1 |
* |
|
7 |
Fuel/Oil prices |
1 |
* |
1 |
-- |
|
8 |
Wage issues |
1 |
* |
* |
* |
|
9 |
Gap between rich and poor |
* |
1 |
-- |
* |
|
10 |
Corporate corruption |
* |
1 |
* |
* |
|
Recession |
-- |
* |
* |
* |
|
|
NON-ECONOMIC PROBLEMS (NET) |
58 |
59 |
78 |
70 |
|
|
1 |
Terrorism |
8 |
9 |
13 |
10 |
|
2 |
Education/ poor education/ access to education |
7 |
4 |
6 |
4 |
|
3 |
Poor healthcare/ hospitals; high cost of healthcare |
7 |
5 |
8 |
5 |
|
4 |
Fear of war/ feelings of fear in this country/ war in Iraq |
7 |
16 |
29 |
35 |
|
5 |
Dissatisfaction with government/ Congress/ politicians/ candidates; Poor leadership; corruption |
7 |
4 |
5 |
2 |
|
6 |
Ethics/ moral/ religious/ family decline; dishonesty; lack of integrity |
6 |
5 |
6 |
4 |
|
7 |
National security |
4 |
3 |
4 |
3 |
|
8 |
Poverty/ hunger/ homelessness |
3 |
3 |
3 |
3 |
|
9 |
Crime/violence |
3 |
2 |
2 |
2 |
|
10 |
Medicare/Social Security issues |
3 |
2 |
2 |
3 |
|
11 |
Lack of respect for each other |
2 |
1 |
* |
-- |
|
12 |
Foreign aid/focus overseas |
2 |
1 |
2 |
1 |
|
13 |
Drugs |
2 |
1 |
1 |
2 |
|
14 |
Immigration/illegal aliens |
2 |
1 |
1 |
1 |
|
15 |
Unifying the country |
1 |
2 |
* |
* |
|
16 |
International issues/ problems |
1 |
1 |
11 |
7 |
|
17 |
Judicial system/ courts/laws |
1 |
* |
2 |
* |
|
18 |
Children's behavior/ way they are raised |
1 |
1 |
* |
1 |
|
19 |
Race relations/ racism |
1 |
* |
* |
1 |
|
20 |
Care for the elderly |
1 |
1 |
1 |
1 |
|
21 |
Abuse of power |
1 |
1 |
-- |
-- |
|
22 |
Environment/ pollution |
1 |
1 |
1 |
1 |
|
23 |
Welfare |
1 |
* |
* |
* |
|
24 |
Election year/ presidential choices/ election reform |
* |
-- |
-- |
-- |
|
25 |
Child abuse |
* |
-- |
1 |
* |
|
26 |
Abortion |
* |
1 |
* |
1 |
|
27 |
Lack of energy sources; the energy crisis |
* |
* |
* |
* |
|
28 |
Lack of military defense |
* |
-- |
* |
-- |
|
29 |
The media |
* |
* |
1 |
* |
|
Guns/gun control |
-- |
* |
-- |
-- |
|
|
School shootings/school violence |
-- |
* |
-- |
-- |
|
|
Overpopulation |
-- |
* |
* |
* |
|
|
AIDS |
-- |
-- |
* |
-- |
|
|
Space shuttle disaster/ NASA |
-- |
-- |
-- |
1 |
|
|
Other non-economic |
4 |
4 |
2 |
1 |
|
|
No opinion |
3 |
5 |
3 |
5 |
|
|
Total |
137% |
124% |
146% |
143% |
|
|
* Less than 0.5% |
|||||