GALLUP NEWS SERVICE
PRINCETON, NJ -- Gallup's annual poll on minority rights and relations finds that more Americans continue to favor decreased over increased immigration, with a substantial percentage saying immigration levels should stay the same. These attitudes are little changed when compared to last year at this time, but these and other data show a somewhat more negative view of immigration than existed before Sept. 11, 2001.
Hispanics' views of immigration are somewhat more positive than those of the general public, and blacks' views tend to be less positive. Older Americans and ideologically conservative Americans are much less positive toward immigration than are younger Americans and those of moderate or liberal political persuasions.
Views of Immigration Levels
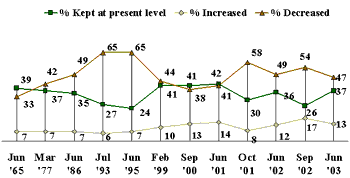
The poll was conducted June 12-18, and finds that 47% of Americans think immigration levels should be decreased, 13% want them increased, and 37% say they should be kept at their present levels. The current figures show little change when compared with last year's Minority Relations poll, but an intervening poll -- conducted just prior to the one-year anniversary of the terrorist attacks -- showed a slightly higher proportion of Americans (54%) favoring decreased immigration.
More generally, Americans' views toward immigration levels are more positive than they were immediately after the terrorist attacks, but remain more negative than they were at the start of this decade. Even with the noticeable effects of 9/11 on Americans' views on immigration, the percentage of Americans favoring decreased immigration was at its highest during the mid-1990s.
| In your view, should immigration be kept at its present level, increased or decreased? |
 |
Whites (49%) are slightly more likely than blacks (44%) -- and substantially more likely than Hispanics (36%) -- to say immigration should be decreased. Alternatively, blacks (20%) and Hispanics (24%) are much more likely than whites (11%) to say immigration should be increased. These views have changed little since the last Minority Relations poll in 2002, but both blacks and Hispanics (and to a lesser extent, whites) are more likely today to say immigration should be decreased than they were in a June 2001 poll.
In your view, should immigration be kept at its present level, increased or decreased?
|
Present level |
Increased |
Decreased |
No opinion |
|
|
% |
% |
% |
% |
|
|
National Adults |
||||
|
2003 Jun 12-18 |
37 |
13 |
47 |
3 |
|
2002 Jun 3-9 |
36 |
12 |
49 |
3 |
|
2001 Jun 11-17 |
42 |
14 |
41 |
3 |
|
Non-Hispanic Whites |
||||
|
2003 Jun 12-15 |
38 |
11 |
49 |
2 |
|
2002 Jun 3-6 |
36 |
9 |
52 |
3 |
|
2001 Jun 11-17 |
42 |
10 |
45 |
3 |
|
Blacks |
||||
|
2003 Jun 12-18 |
33 |
20 |
44 |
3 |
|
2002 Jun 3-9 |
34 |
16 |
46 |
4 |
|
2001 Jun 11-17 |
42 |
24 |
31 |
3 |
|
Hispanics |
||||
|
2003 Jun 12-18 |
35 |
24 |
36 |
5 |
|
2002 Jun 3-9 |
37 |
24 |
37 |
2 |
|
2001 Jun 11-17 |
38 |
33 |
25 |
4 |
There are also differences by age in the way Americans view immigration, with young adults being the most supportive of it, and opposition gradually increasing with age. Only 38% of 18- to 29-year-olds would like to see immigration decreased. This rises to 44% among 30- to 49-year-olds, to 52% among 50- to 64-year-olds, and to 60% among those aged 65 and older. A plurality of 18- to 29-year-olds say immigration should be kept at its present level (in the other age groups, "decreased" is the plurality or majority response).
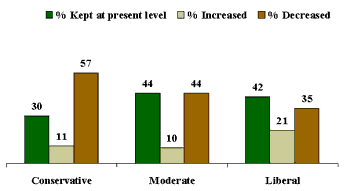
Political ideology also is significantly related to one's view of how much immigration there should be to the United States. Fifty-seven percent of conservatives say these levels should be decreased, compared with 44% of moderates and only 35% of liberals. The plurality of liberals say immigration should be kept at its present levels, and liberals are roughly twice as likely as moderates and conservatives to say immigration levels should be increased.
| Views on Immigration by Political Ideology |
 |
| Jun. 12-18, 2003 |
Evaluations of Immigration's Impact on the United States
Consistent with past Gallup polling, Americans continue to endorse the general idea of immigration today, even while they resist expanding it. Fifty-eight percent say "immigration is a good thing" for the country today, while 36% say it is "a bad thing." This percentage is slightly more positive than last year, when 52% said immigration was a good thing, but remains below the pre-9/11 rating of 62%.
Blacks (48%) are somewhat less positive in their assessment of current immigration than are whites (58%) and Hispanics (65%). All three groups show declines from the pre-9/11 poll, with the greatest decline evident among blacks.
Percentage Saying Immigration Is Good for the Country Today, by Racial and Ethnic Group
|
2001 |
2002 |
2003 |
Change from pre-9/11 |
|
|
% |
% |
% |
% |
|
|
All Adults |
62 |
52 |
58 |
-4 |
|
Non-Hispanic White |
62 |
51 |
58 |
-4 |
|
Black |
61 |
46 |
48 |
-13 |
|
Hispanic |
73 |
67 |
65 |
-8 |
Views of the effects of current immigration are related to one's age and ideology in a similar manner to that described above for views of immigration levels. There are also large differences in attitudes by household income: 75% of those whose incomes are $75,000 or greater say immigration is good for the country today, which declines to about 6 in 10 in households with incomes between $30,000 and $75,000, and to fewer than half (46%) of those in households with incomes below $30,000.
When asked about the impact of past immigration on the United States, Americans' views remain at the same positive level they have held since June 2001. Three in four Americans say immigration has been a good thing for the United States in the past, the same proportion as in the two previous Minority Relations polls. Again, blacks (59%) are somewhat less positive in their assessment of past immigration than are whites (77%) and Hispanics (77%), a pattern evident over the past three years. Differences according to ideology are also apparent, but to a lesser degree than that observed in the public's views about immigration today. Gaps between income groups on this retrospective immigration question are similar to those on the question about immigration today.
Immigrants and American Culture
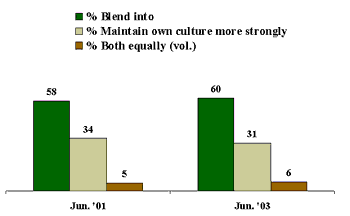
Sixty percent of Americans say it is better for the United States to "encourage immigrants to blend into American culture by giving up some important aspects of their own culture," while 31% disagree and say it is better to "encourage immigrants to maintain their own culture more strongly, even if that means they do not blend in as well."
| Which do you think is better for the United States -- to encourage immigrants to blend into American culture by giving up some important aspects of their own culture, or to encourage immigrants to maintain their own culture more strongly, even if that means they do not blend in as well? |
 |
Whites (63%) are more likely to say that immigrants should blend into American culture than are blacks (47%) or Hispanics (52%). Hispanics' opinions have shifted somewhat when compared to 2001, when the question was last asked. At that time, by a 49% to 45% margin, Hispanics said immigrants should maintain their own culture. Now, 52% of Hispanics say immigrants should blend into American culture and 40% say they should maintain their own culture.
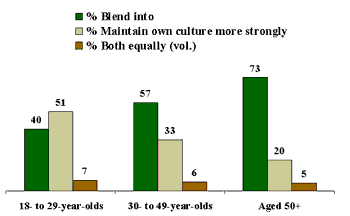
A majority of 18- to 29-year-olds say immigrants should be encouraged to maintain their culture, while 40% say immigrants should blend into American culture. The majority of 30- to 49-year-olds (57%) and of those 50 and older (73%) believe immigrants should try to blend in.
| Which do you think is better for the United States -- to encourage immigrants to blend into American culture by giving up some important aspects of their own culture, or to encourage immigrants to maintain their own culture more strongly, even if that means they do not blend in as well? |
 |
Sixty-eight percent of conservatives think it is better for immigrants to blend into American culture, compared with 62% of moderates. Liberals are divided in their views, as 45% say immigrants should blend into American culture and 46% say they should maintain their own culture.
Hispanics Most Likely to Be Recent Immigrants
The poll also asked Americans about their family backgrounds. Ninety-two percent of Americans say they were born in the United States and 8% in another country. More than 9 in 10 blacks and whites were born in the United States, but only about two in three Hispanics were born in this country.
About 11% of Americans were born in the United States but at least one of their parents was born in another country. Only about 4 in 10 Hispanics are third-generation Americans (i.e., the respondent and both of the respondent's parents were born in the United States) compared with close to 90% of both whites and blacks.
SUMMARY TABLE: IMMIGRATION TO THE UNITED STATES
|
Immigrant |
|
3RD generation or higher |
|
|
|
% |
% |
% |
% |
|
|
National Adults |
||||
|
2003 Jun 12-18 |
8 |
11 |
81 |
* |
|
2002 Jun 3-9 |
8 |
11 |
81 |
* |
|
Non-Hispanic Whites |
||||
|
2003 Jun 12-15 |
3 |
9 |
88 |
* |
|
2002 Jun 3-6 |
3 |
10 |
87 |
* |
|
Blacks |
||||
|
2003 Jun 12-18 |
7 |
6 |
87 |
-- |
|
2002 Jun 3-9 |
8 |
3 |
89 |
-- |
|
Hispanics |
||||
|
2003 Jun 12-18 |
36 |
23 |
41 |
-- |
|
2002 Jun 3-9 |
33 |
28 |
39 |
* |
|
* Less than 0.5% |
||||
As might be expected, Americans whose families have recently come to the United States express somewhat more positive attitudes about immigration than do those whose families have been in the United States for at least a couple of generations.
Survey Methods
Results are based on telephone interviews with 1,385 national adults, aged 18+, conducted June 12-18, 2003, including oversamples of blacks and Hispanics that are weighted to reflect their proportions in the general population. For results based on the total sample of national adults, one can say with 95% confidence that the maximum margin of sampling error is ±3 percentage points.
Results for the sample of 821 non-Hispanic whites, aged 18+, are based on telephone interviews conducted June 12-15, 2003. For results based on the total sample, one can say with 95% confidence that the margin of sampling error is ±4 percentage points.
Results for the sample of 241 blacks, aged 18+, are based on telephone interviews conducted June 12-18, 2003. For results based on the total sample, one can say with 95% confidence that the margin of sampling error is ±7 percentage points.
Results for the sample of 266 Hispanics (including 12 Hispanic respondents who identified their race as black), aged 18+, are based on telephone interviews conducted June 12-18, 2003. For results based on the total sample, one can say with 95% confidence that the margin of sampling error is ±7 percentage points. (Fifty-three out of the 266 interviews with Hispanics were conducted in Spanish.)
In addition to sampling error, question wording and practical difficulties in conducting surveys can introduce error or bias into the findings of public opinion polls.
Thinking some more about immigrants -- that is, people who come from other countries to live here in the United States,
15. In your view, should immigration be kept at its present level, increased or decreased?
|
Present level |
Increased |
Decreased |
No opinion |
|
|
% |
% |
% |
% |
|
|
2003 Jun 12-18 |
37 |
13 |
47 |
3 |
|
2002 Sep 2-4 |
26 |
17 |
54 |
3 |
|
2002 Jun 3-9 |
36 |
12 |
49 |
3 |
|
2001 Oct 19-21 |
30 |
8 |
58 |
4 |
|
2001 Jun 11-17 |
42 |
14 |
41 |
3 |
|
2001 Mar 26-28 |
41 |
10 |
43 |
6 |
|
2000 Sep 11-13 |
41 |
13 |
38 |
8 |
|
1999 Feb 26-28 ^ |
41 |
10 |
44 |
5 |
|
1995 Jul 7-9 |
27 |
7 |
62 |
4 |
|
1995 Jun 5-6 |
24 |
7 |
65 |
4 |
|
1993 Jul 9-11 |
27 |
6 |
65 |
2 |
|
1986 Jun 19-23 † |
35 |
7 |
49 |
9 |
|
1977 Mar 25-28 |
37 |
7 |
42 |
14 |
|
1965 Jun 24-29 |
39 |
7 |
33 |
20 |
|
^ Based on 514 national adults; margin of error ±5 PCT. PTS. |
||||
|
† CBS/New York Times poll. |
||||
Q.16-17 ROTATED
16. On the whole, do you think immigration is a good thing or
a bad thing for this country today?
|
Good thing |
Bad thing |
MIXED (vol.) |
No opinion |
|
|
% |
% |
% |
% |
|
|
National Adults |
||||
|
2003 Jun 12-18 |
58 |
36 |
4 |
2 |
|
2002 Jun 3-9 |
52 |
42 |
4 |
2 |
|
2001 Jun 11-17 |
62 |
31 |
5 |
2 |
|
Men |
||||
|
2003 Jun 12-18 |
65 |
30 |
3 |
2 |
|
2002 Jun 3-9 |
56 |
39 |
4 |
1 |
|
2001 Jun 11-17 |
68 |
28 |
2 |
2 |
|
Women |
||||
|
2003 Jun 12-18 |
51 |
43 |
5 |
1 |
|
2002 Jun 3-9 |
49 |
45 |
4 |
2 |
|
2001 Jun 11-17 |
57 |
33 |
7 |
3 |
|
Non-Hispanic Whites |
||||
|
2003 Jun 12-15 |
58 |
38 |
3 |
1 |
|
2002 Jun 3-6 |
51 |
43 |
4 |
2 |
|
2001 Jun 11-17 |
62 |
32 |
4 |
2 |
|
Blacks |
||||
|
2003 Jun 12-18 |
48 |
45 |
6 |
1 |
|
2002 Jun 3-9 |
46 |
46 |
6 |
2 |
|
2001 Jun 11-17 |
61 |
28 |
7 |
4 |
|
Hispanics |
||||
|
2003 Jun 12-18 |
65 |
29 |
4 |
2 |
|
2002 Jun 3-9 |
67 |
27 |
4 |
2 |
|
2001 Jun 11-17 |
73 |
18 |
2 |
7 |
|
(vol.) Volunteered response |
||||
17. On the whole, do you think immigration has been a good thing or a bad thing for the United States in the past?
|
Good thing |
Bad thing |
MIXED (vol.) |
No opinion |
|
|
% |
% |
% |
% |
|
|
National Adults |
||||
|
2003 Jun 12-18 |
75 |
21 |
2 |
2 |
|
2002 Jun 3-9 |
75 |
20 |
4 |
1 |
|
2001 Jun 11-17 |
75 |
19 |
4 |
2 |
|
Men |
||||
|
2003 Jun 12-18 |
79 |
18 |
2 |
1 |
|
2002 Jun 3-9 |
77 |
18 |
4 |
1 |
|
2001 Jun 11-17 |
81 |
15 |
3 |
1 |
|
Women |
||||
|
2003 Jun 12-18 |
72 |
25 |
1 |
2 |
|
2002 Jun 3-9 |
73 |
22 |
4 |
1 |
|
2001 Jun 11-17 |
69 |
23 |
5 |
3 |
|
Non-Hispanic Whites |
||||
|
2003 Jun 12-15 |
77 |
20 |
2 |
1 |
|
2002 Jun 3-6 |
77 |
18 |
4 |
1 |
|
2001 Jun 11-17 |
75 |
19 |
4 |
2 |
|
Blacks |
||||
|
2003 Jun 12-18 |
59 |
37 |
1 |
3 |
|
2002 Jun 3-9 |
59 |
34 |
6 |
1 |
|
2001 Jun 11-17 |
63 |
27 |
7 |
3 |
|
Hispanics |
||||
|
2003 Jun 12-18 |
77 |
18 |
3 |
2 |
|
2002 Jun 3-9 |
80 |
15 |
4 |
1 |
|
(vol.) Volunteered response |
||||
18. Which do you think is better for the United States -- [ROTATED: to encourage immigrants to blend into American culture by giving up some important aspects of their own culture, or to encourage immigrants to maintain their own culture more strongly, even if that means they do not blend in as well]?
|
|
Maintain own culture more |
BOTH/ |
No |
|
|
% |
% |
% |
% |
|
|
National Adults |
||||
|
2003 Jun 12-18 |
60 |
31 |
6 |
3 |
|
2001 Jun 11-17 |
58 |
34 |
5 |
3 |
|
Men |
||||
|
2003 Jun 12-18 |
61 |
30 |
6 |
3 |
|
2001 Jun 11-17 |
59 |
34 |
4 |
3 |
|
Women |
||||
|
2003 Jun 12-18 |
58 |
33 |
6 |
3 |
|
2001 Jun 11-17 |
57 |
34 |
5 |
4 |
|
Non-Hispanic Whites |
||||
|
2003 Jun 12-15 |
63 |
29 |
6 |
2 |
|
2001 Jun 11-17 |
61 |
31 |
5 |
3 |
|
Blacks |
||||
|
2003 Jun 12-18 |
47 |
41 |
6 |
6 |
|
2001 Jun 11-17 |
48 |
43 |
4 |
5 |
|
Hispanics |
||||
|
2003 Jun 12-18 |
52 |
40 |
4 |
4 |
|
2001 Jun 11-17 |
45 |
49 |
2 |
4 |
|
(vol.) Volunteered response |
||||
Turning to your own background,
20. Were you born in the United States or in another country?
|
The U.S. |
Another country |
No opinion |
|||||
|
% |
% |
% |
|||||
|
National Adults |
|||||||
|
2003 Jun 12-18 |
92 |
8 |
* |
||||
|
2002 Jun 3-9 |
92 |
8 |
* |
||||
|
2001 Jun 11-17 |
93 |
7 |
* |
||||
|
Men |
|||||||
|
2003 Jun 12-18 |
91 |
9 |
* |
||||
|
2002 Jun 3-9 |
92 |
8 |
* |
||||
|
2001 Jun 11-17 |
92 |
8 |
* |
||||
|
Women |
|||||||
|
2003 Jun 12-18 |
93 |
7 |
* |
||||
|
2002 Jun 3-9 |
93 |
7 |
-- |
||||
|
2001 Jun 11-17 |
93 |
7 |
-- |
||||
|
Non-Hispanic Whites |
|||||||
|
2003 Jun 12-15 |
97 |
3 |
* |
||||
|
2002 Jun 3-6 |
97 |
3 |
-- |
||||
|
2001 Jun 11-17 |
97 |
3 |
-- |
||||
|
Blacks |
|||||||
|
2003 Jun 12-18 |
94 |
6 |
-- |
||||
|
2002 Jun 3-9 |
92 |
8 |
-- |
||||
|
2001 Jun 11-17 |
87 |
13 |
-- |
||||
|
Hispanics |
|||||||
|
2003 Jun 12-18 |
64 |
36 |
-- |
||||
|
2002 Jun 3-9 |
66 |
34 |
* |
||||
|
2001 Jun 11-17 |
53 |
47 |
-- |
||||
|
* Less than 0.5% |
|||||||
21. Were either of your parents born in another country, or were both of your parents born in the United States?
|
Another country |
The U.S. |
No opinion |
|||||
|
% |
% |
% |
|||||
|
National Adults |
|||||||
|
2003 Jun 12-18 |
18 |
82 |
* |
||||
|
2002 Jun 3-9 |
18 |
82 |
* |
||||
|
2001 Jun 11-17 |
18 |
82 |
-- |
||||
|
Men |
|||||||
|
2003 Jun 12-18 |
17 |
83 |
* |
||||
|
2002 Jun 3-9 |
17 |
83 |
* |
||||
|
2001 Jun 11-17 |
19 |
81 |
-- |
||||
|
Women |
|||||||
|
2003 Jun 12-18 |
18 |
82 |
* |
||||
|
2002 Jun 3-9 |
18 |
82 |
-- |
||||
|
2001 Jun 11-17 |
17 |
83 |
-- |
||||
|
Non-Hispanic Whites |
|||||||
|
2003 Jun 12-15 |
11 |
89 |
* |
||||
|
2002 Jun 3-6 |
11 |
89 |
* |
||||
|
2001 Jun 11-17 |
13 |
87 |
-- |
||||
|
Blacks |
|||||||
|
2003 Jun 12-18 |
12 |
88 |
-- |
||||
|
2002 Jun 3-9 |
8 |
92 |
-- |
||||
|
2001 Jun 11-17 |
18 |
82 |
-- |
||||
|
Hispanics |
|||||||
|
2003 Jun 12-18 |
56 |
44 |
-- |
||||
|
2002 Jun 3-9 |
59 |
41 |
* |
||||
|
2001 Jun 11-17 |
73 |
27 |
-- |
||||
|
* Less than 0.5% |
|||||||
