Does income buy happiness? This oft-debated question now has a definitive answer: Yes -- up to a point.
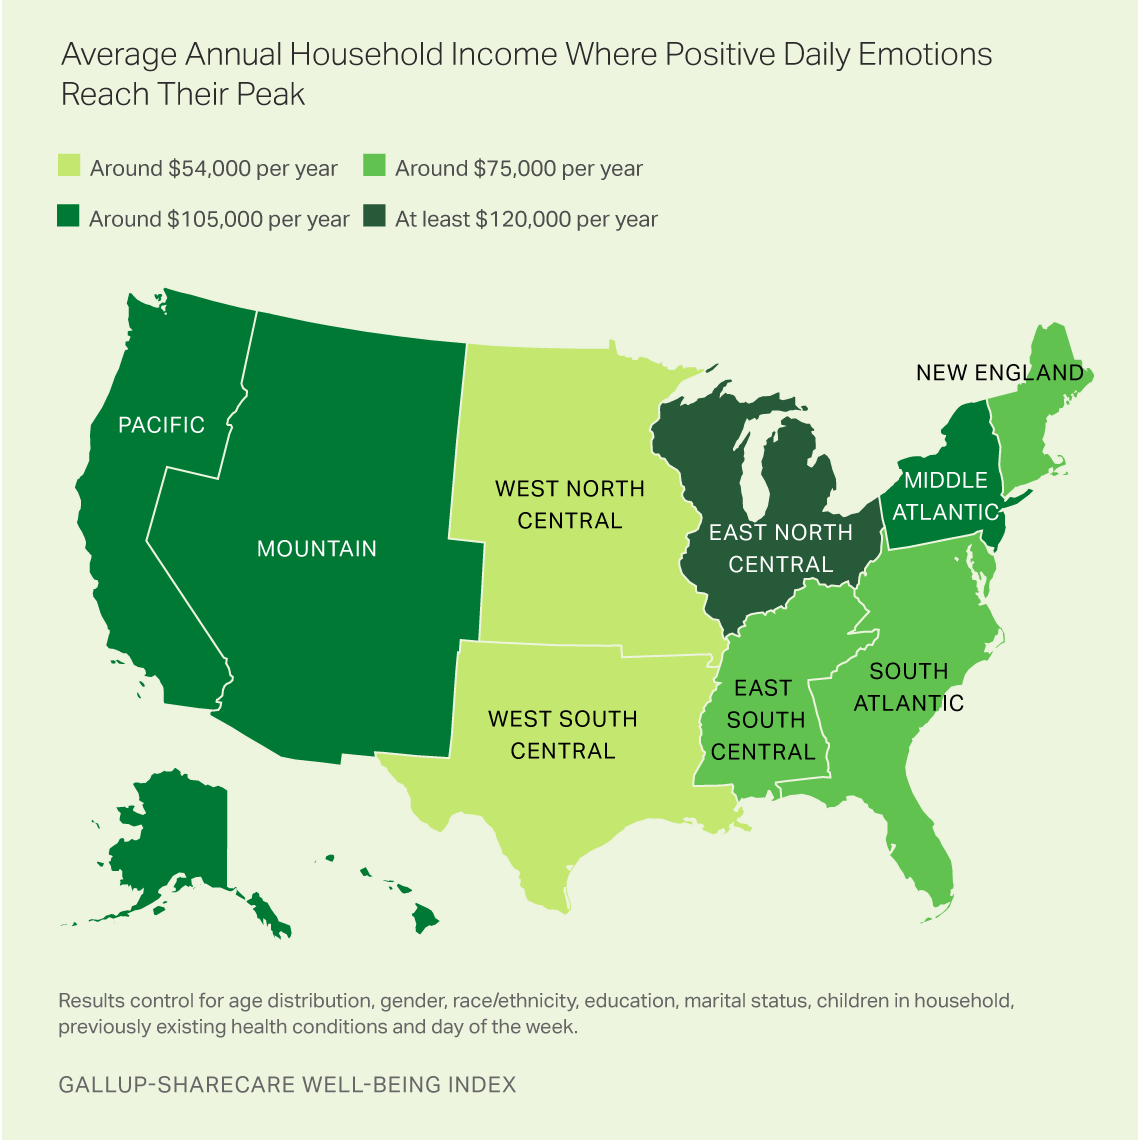
Moreover, the income ceiling is lower in some regions of the country than others for maximizing the chances that positive emotions such as happiness will be experienced on any given day.
In the U.S., the chances of experiencing three positive emotions or actions -- happiness, enjoyment and smiling/laughter -- on any given day increases with household income. But those chances reach their limit at around $75,000 per year.
This limit varies regionally, however. Some areas maximize positive emotions at much lower income levels than others.
For example, adult residents of the West North Central and West South Central regions both reach their peak emotional potential at around $54,000 per year. Residents of the East North Central region, on the other hand, require heftier incomes -- at least $120,000 per year -- to achieve the same level.

This analysis is a part of a broader special research project by Gallup and Sharecare in conjunction with TIME magazine. It is inspired by the seminal work originally conducted by Gallup Senior Scientists and Nobel Laureates Daniel Kahneman and Angus Deaton.
Their August 2010 research concluded that daily emotional experiences among all U.S. adults -- both positive and negative -- improved with household income up to about $75,000 per year before reaching their best respective thresholds. (Kahneman and Deaton published their findings in the Proceeding of the National Academy of Sciences.)
Life Satisfaction Keeps Climbing With Income in All Regions
The work by Kahneman and Deaton also concluded that a more general evaluation of one's life -- determined by the Cantril Self-Anchoring Striving Scale -- did not reach an income ceiling as did daily emotional experiences.
The Cantril metric, which asks respondents to envision a ladder with steps numbered zero through 10 -- where the top step represents their "best possible life" -- was shown to continue to improve with ever-increasing amounts of household income.
In examining the relationship among income, a general evaluation of one's life and one's geography, reports of placement on the ladder of life's "steps" consistently climbed with each successive income bracket in every region. Without exception, residents in the highest income bracket had the best overall life satisfaction ratings of residents in every region across the U.S.
Income's Impact on Positive Emotions Varies by Region
Historically, the measurement of subjective well-being has been divided into two major categories: how respondents evaluate their lives generally and how they experience their lives day-to-day. Stated simply, experiential well-being focuses on recent, momentary experiences while evaluative well-being is more broadly concerned with the way people think about and remember those life experiences more cumulatively, oftentimes long after they have already occurred.
Income influences both of these forms of well-being, but in different ways: The likelihood of experiencing positive emotions on any given day is elevated by income, but only to a certain extent. The more general evaluation of one's current life, however, continues to improve with each successive income bracket.
Geographically, the differences in the maximum impact that household income has on the chances of experiencing positive emotions vary substantially by region. In the central U.S. -- exemplified in the West South Central and West North Central regions, running from Texas northward through the Northern Plains -- income's apparent impact on positive emotions plateaus around $54,000 per year. Beyond this point, ever greater amounts of income yield no greater odds of experiencing positive emotions on any given day.
Residents of regions with a higher cost of living, such as the Pacific and Middle Atlantic do not hit this emotional plateau until nearly double the income level.
These results suggest that cost of living may play a role in the relationship between different income levels and odds of experiencing positive emotions, but not all regions follow this pattern: The East North Central region around the Great Lakes comes with the highest price tag of all at $120,000+ per year to reach maximum positive emotions, for reasons that aren't immediately clear.
Inspired by and building upon the work of Kahneman and Deaton, the research from the Gallup-Sharecare special project with TIME reveals that the central findings of the original work remain intact -- but that there is also a defined range for income's impact on positive daily emotions depending on where one lives.
Read TIME magazine's article based on Gallup's research about the cities where you can be happiest with less money.
Survey Methods
These results are based on nearly 450,000 interviews with randomly selected U.S. adults across all 50 states and the District of Columbia, conducted from Jan. 2, 2014, through Dec. 30, 2016. Respondents were asked, "Did you experience the following feelings a lot of the day yesterday? How about: happiness/enjoyment/smiling or laughter?"
The results are based on the mean score across each of the emotions/actions for each region after controlling for demographic factors such as gender, age, race/ethnicity, education, marital status, children in the household, previously existing health conditions and day of the week. The number of occupants per household is not controlled for.
Each daily sample of national adults for data collected between Jan. 2, 2014, and Aug. 31, 2015, comprised 50% cellphone respondents and 50% landline respondents. Each daily sample beginning Sept. 1, 2015, through Dec. 30, 2016, comprised 60% cellphone respondents and 40% landline respondents. Additional minimum quotas by time zone within region are included in the sampling approach.
At the maximized household income level for all nine regions, the average percentage who reported experiencing each of the emotions/actions on any given day is about 88-89%. In the lowest income bracket of under $24,000 per year, the average percentage who reported experiencing the emotions/actions is in the 73-77% range. The percentage climbs with higher income. The peak level for each region is determined when subsequent income levels fail statistically to elevate positive emotions.
Learn more about how the Gallup-Sharecare Well-Being Index works.
