PRINCETON, NJ -- Most people hope to unwrap some surprises under their Christmas tree this year. A recent Gallup Poll finds that a majority of adults who celebrate Christmas prefer to receive a gift that is a surprise from someone rather than to receive something they know they are getting because they specifically asked for it. A majority of respondents in the poll also say they and their families usually open their gifts on Christmas Day; only about one in five open their presents on Christmas Eve, while about 1 in 10 exchange gifts on both days.
"Hmmm -- Should I Write a List or Just Be Surprised?"
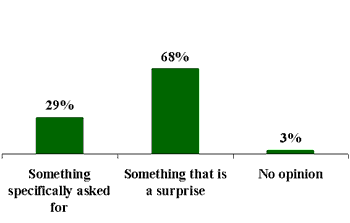
The vast majority of Americans -- 95% -- say they celebrate Christmas, and roughly two in three of those tell Gallup they prefer to receive gifts that are a surprise from someone, while just about 3 in 10 say they would prefer to receive something they knew about and specifically asked for.
| Which type of Christmas gift would you
prefer to receive -- something you knew you were getting because you specifically asked for it, (or) something you got as a surprise that someone thought you would like? Based on adults who celebrate Christmas |
 |
| Dec. 11-14, 2003 |
"Can I Open at Least One Present Early?"
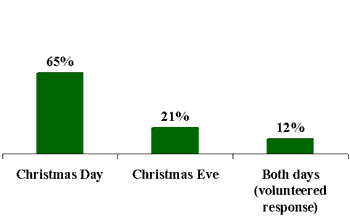
Sixty-five percent of Christmas celebrators say that they and their families generally open their presents on Christmas Day, while just 21% open presents on Christmas Eve. Twelve percent volunteer that they exchange presents on both days, but when those in this group are pressed to indicate on which day they open the most presents, the majority say they open more gifts on Christmas Day.
| Do you and your immediate family generally
open your presents on -- Christmas Day (or) Christmas Eve? Based on adults who celebrate Christmas |
 |
| Dec. 11-14, 2003 |
There are some interesting demographic differences on this measure, even though a majority of all respondents unwrap their Christmas gifts on Christmas Day.
- Older people who celebrate Christmas are somewhat more inclined to exchange gifts on Christmas Eve than are younger people. Only 18% of adults aged 18 to 49 open gifts on Christmas Eve, but this increases to 24% for 50- to 64-year-olds and 29% for adults aged 65 and older. Roughly two-thirds of adults aged 18 to 49 exchange presents on Christmas Day.
- Churchgoers who attend services at least monthly are more likely than those who attend church infrequently to open gifts on Christmas Day. Seventy percent of more frequent churchgoers exchange gifts on Christmas Day, compared with 58% of those attending church less often. Essentially the same percentages of more frequent and less frequent churchgoers open presents on Christmas Eve (20% and 23%, respectively).
- Protestants are just slightly more likely than Catholics to say they open presents on Christmas Day, by a margin of 66% to 58%. Catholics are somewhat more likely to open gifts on Christmas Eve (by 28% to 20%).
- People living in the Midwest are less likely than people living in other parts of the country to say they open presents on Christmas Day. Just 58% of Midwesterners open gifts on the 25th, compared with 67% of people in the Eastern part of the country, 69% of Southerners, and 65% of people in the Western part of the United States.
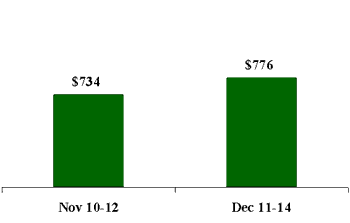
Americans' Estimated Christmas Spending Up an Average of $42 Since Mid-November
In a mid-November Gallup Poll, the average amount American adults indicated that they would be personally spending on Christmas presents was $734. Gallup's Dec. 11-14 survey finds that these estimates have risen slightly as the holiday has drawn nearer, and now average $776. This includes 31% of respondents who plan to spend $1,000 or more on gifts, 28% who plan to spend between $500 and $999, and 34% who plan to spend less than $500 on gifts.
The $42 per-person increase in spending plans between Gallup's mid-November measure and the current estimate reflects a similar pattern found last year, when the amount of money respondents planned to spend on gifts increased as Christmas drew closer.
| Roughly how much money do you think you
personally will spend on Christmas gifts this year? Average of respondents’ estimates |
 |
When asked to characterize their level of spending, the majority of Americans, 58%, say they will spend about the same amount on gifts as they did last Christmas. Nineteen percent say they plan to spend more, and 21% say they plan to spend less on gifts this season. These results have changed just slightly since mid-November, when 61% said they planned to spend the same amount, 14% said they planned to spend more, and 23% said they planned to spend less.
Survey Methods
These results are based on telephone interviews with a randomly selected national sample of 1,011 adults, aged 18 and older, conducted Dec. 11-14, 2003. For results based on this sample, one can say with 95% confidence that the maximum error attributable to sampling and other random effects is ±3 percentage points. For results based on the sample of 953 adults who celebrate Christmas, the maximum margin of sampling error is ±3 percentage points. In addition to sampling error, question wording and practical difficulties in conducting surveys can introduce error or bias into the findings of public opinion polls.
36. Roughly how much money do you think you personally will spend on Christmas gifts this year?
|
$1,000 or more |
|
|
|
|
No opin-ion |
|
Mean (w/ zero) |
Mean (w/o zero) |
|
|
% |
% |
% |
% |
% |
% |
||||
|
2003 Dec 11-14 |
31 |
28 |
18 |
13 |
3 |
7 |
$500 |
$776 |
$794 |
|
2003 Nov 10-12 |
30 |
25 |
18 |
14 |
3 |
10 |
$500 |
$734 |
$773 |
Trends for Comparison:
|
$1,000 or more |
|
|
|
|
No opin-ion |
Median |
Mean (w/ zero) |
Mean (w/o zero) |
|
|
% |
% |
% |
% |
% |
|||||
|
1998 Dec 4-6 |
24 |
25 |
22 |
14 |
8 |
7 |
-- |
-- |
-- |
|
1994 Dec 2-5 |
22 |
20 |
23 |
19 |
9 |
7 |
-- |
-- |
-- |
|
1993 Dec 4-6 |
19 |
27 |
20 |
17 |
8 |
9 |
-- |
-- |
-- |
|
1992 Dec 12-18 |
19 |
24 |
20 |
18 |
10 |
9 |
-- |
-- |
-- |
|
1991 Dec 12-15 |
20 |
24 |
22 |
19 |
7 |
8 |
-- |
-- |
-- |
|
1990 Nov 29-Dec 2 |
17 |
25 |
23 |
19 |
7 |
9 |
-- |
-- |
-- |
|
1989 Oct 12-15 |
18 |
23 |
25 |
15 |
4 |
15 |
-- |
-- |
-- |
37. Is that more, less, or about the same amount as you spent last Christmas?
|
|
|
About |
No |
|
|
% |
% |
% |
% |
|
|
2003 Dec 11-14 |
19 |
21 |
58 |
2 |
|
2003 Nov 10-12 |
14 |
23 |
61 |
2 |
|
2002 Nov 22-24 |
19 |
24 |
56 |
1 |
|
2002 Nov 11-14 |
12 |
27 |
59 |
2 |
|
2002 Oct 14-17 |
12 |
22 |
64 |
2 |
|
2000 Nov 13-15 |
17 |
18 |
64 |
1 |
|
1999 Nov 18-21 |
19 |
20 |
61 |
* |
|
1998 Dec 4-6 |
19 |
21 |
60 |
* |
|
1994 Dec 2-5 |
18 |
20 |
62 |
0 |
|
1993 Dec 4-6 |
20 |
27 |
53 |
* |
|
1992 Dec 18-20 |
22 |
28 |
50 |
* |
|
1991 Dec 12-15 |
16 |
33 |
43 |
8 |
|
1990 Nov 29-Dec 2 |
15 |
26 |
57 |
2 |
|
* Less than 0.5% |
||||
38. Do you celebrate Christmas?
|
Yes |
No |
CELEBRATE HANUKKAH (vol.) |
CELEBRATE KWANZAA (vol.) |
|
|
|
2003 Dec 11-14 |
95% |
5 |
* |
-- |
-- |
|
2000 Dec 2-4 |
96% |
4 |
-- |
-- |
* |
|
1994 Dec 16-18 |
96% |
4 |
-- |
-- |
* |
|
* Less than 0.5% |
|||||
|
(vol.) Volunteered response |
|||||
39. Do you and your immediate family generally open your presents on -- [ROTATED: Christmas Day (or) Christmas Eve]?
[BASED ON -- 953 -- ADULTS WHO CELEBRATE CHRISTMAS]
|
Christmas Day |
Christmas Eve |
BOTH |
NEITHER (vol.) |
No |
|
|
2003 Dec 11-14 |
65% |
21 |
12 |
2 |
* |
|
* Less than 0.5% |
|||||
|
(vol.) Volunteered response |
|||||
40. (If Both) Do you and your family open most of your presents on -- [ROTATED: Christmas Day (or) Christmas Eve]?
COMBINED RESPONSES: ADULTS WHO CELEBRATE CHRISTMAS
|
2003 Dec 11-14 |
||
|
% |
||
|
Generally open presents on Christmas Day |
65 |
|
|
OPEN PRESENTS ON BOTH (vol.) |
12 |
|
|
(Open most on Christmas Day) |
(8) |
|
|
(Both days equally) |
(1) |
|
|
(Open most on Christmas Eve) |
(3) |
|
|
Generally open presents on Christmas Eve |
21 |
|
|
OPEN PRESENTS ON NEITHER DAY (vol.) |
2 |
|
|
No opinion |
* |
|
|
* Less than 0.5% |
||
|
(vol.) Volunteered response |
||
41. Which type of Christmas gift would you prefer to receive -- [ROTATED: something you knew you were getting because you specifically asked for it, (or) something you got as a surprise that someone thought you would like]?
[BASED ON -- 953 -- ADULTS WHO CELEBRATE CHRISTMAS]
|
Specifically asked for |
Surprise |
No opinion |
|
|
2003 Dec 11-14 |
29% |
68 |
3 |
