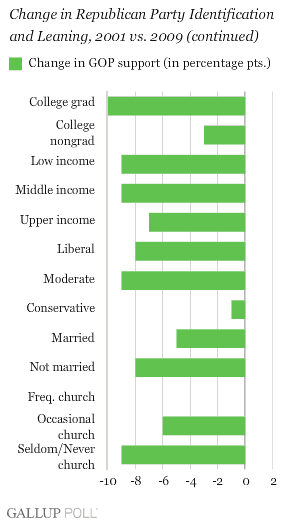
PRINCETON, NJ -- The decline in Republican Party affiliation among Americans in recent years is well documented, but a Gallup analysis now shows that this movement away from the GOP has occurred among nearly every major demographic subgroup. Since the first year of George W. Bush's presidency in 2001, the Republican Party has maintained its support only among frequent churchgoers, with conservatives and senior citizens showing minimal decline.
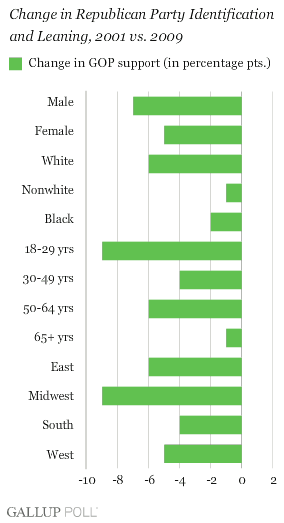
So far in 2009, aggregated Gallup Poll data show the divide on leaned party identification is 53% Democratic and 39% Republican -- a marked change from 2001, when the parties were evenly matched, according to an average of all of that year's Gallup Polls. That represents a loss of five points for the Republicans and a gain of eight points for the Democrats.
The parties were also evenly matched on basic party identification in 2001 (which does not take into account the partisan leanings of independents), with 32% identifying themselves as Republicans, 33% as Democrats, and 34% as independents. The 2009 data show the GOP losing five points since then, with identification increasing three points among both Democrats and independents.
As was shown earlier, the GOP's loss in leaned support over this time is evident among nearly every subgroup. The losses are substantial among college graduates, which have shown a decline in GOP support of 10 points. (The losses are even greater -- 13 points -- among the subset of college graduates with postgraduate educations.) This may reflect in part Barack Obama's strong appeal to educated voters, a major component of his winning coalitions in both the Democratic primaries and the general election.
Aside from education, for which the parties were basically at even strength in 2001, the Republicans' losses tend to be greater among groups that were not strong GOP supporters to begin with. These include self-identified liberals and moderates, church non-attenders, and lower-income and young adults. Thus, a big factor in the GOP's overall decline is the Democratic Party's consolidating its support among normally Democratically leaning groups.
In turn, the GOP has generally avoided significant losses among only its most loyal groups, including frequent churchgoers and self-identified conservatives. The Republican Party maintains majority support among these two groups.
Two exceptions to this general pattern are senior citizens, and racial and ethnic minorities. Republican support among blacks and the larger group of nonwhites has not changed much in the past eight years, but these groups have shown only very limited support for the Republican Party. And while Obama's candidacy seemed to attract young voters to the Democratic Party during the 2008 presidential campaign, it did not have the same effect on older voters. As a result, the share of older voters aligned with the Republican Party has generally held steady.
Implications
The Republican Party clearly has lost a lot of support since 2001, the first year of George W. Bush's administration. Most of the loss in support actually occurred beginning in 2005, after Hurricane Katrina and Bush's nomination of Harriet Miers to the Supreme Court -- both of which created major public relations problems for the administration -- and amid declining support for the Iraq war. By the end of 2008, the party had its worst positioning against the Democrats in nearly two decades.
The GOP may have stemmed those losses for now, as it does not appear to have lost any more support since Obama took office. But as the analysis presented here shows, the losses the GOP has suffered have come among nearly all demographic groups apart from some of the most ardent Republican subgroups.
Survey Methods
Results are based on telephone interviews with 7,139 national adults, aged 18 and older, in Gallup polls conducted January-April 2009. For results based on the total sample of national adults, one can say with 95% confidence that the maximum margin of sampling error is ±1 percentage point.
Margins of error for subgroups will be larger.
Interviews are conducted with respondents on land-line telephones (for respondents with a land-line telephone) and cellular phones (for respondents who are cell-phone only).
In addition to sampling error, question wording and practical difficulties in conducting surveys can introduce error or bias into the findings of public opinion polls.
