GALLUP NEWS SERVICE
PRINCETON, NJ -- As an Oklahoma jury debates the punishment of Terry Nichols, convicted last week of 161 counts of first-degree murder in the Oklahoma City bombing in 1995, a recent Gallup survey finds Americans about evenly divided in their views of the appropriate punishment for murder. About half of all Americans choose the death penalty, while just under half opt for life imprisonment without the possibility of parole. When Americans are not presented with life imprisonment as an alternative, about 7 in 10 support the death penalty. Most Americans also believe the death penalty is applied fairly, and about half say it is not imposed often enough. A majority believes it is not a deterrent to murder, but perceptions of deterrence have only a modest effect on support.
In 1997, Nichols was found guilty in federal court of helping Timothy McVeigh construct a bomb that was used to destroy a federal office building in Oklahoma City in 1995. The blast killed 168 people, including eight federal officials. At the time, a CNN/USA Today/Gallup poll found that 45% of Americans thought Nichols should be sentenced to death for his actions, while 42% supported life imprisonment. In fact, the judge sentenced Nichols to life imprisonment.
In 1999, Oklahoma prosecutors took Nichols to court again, this time for the deaths of 160 people who were not federal officials, plus one woman's fetus. Last Wednesday, a state jury found Nichols guilty of first-degree murder on all 161 counts. Once again, prosecutors are seeking the death penalty.
The current poll finds a margin of 50% to 46% in favor of the death penalty over life imprisonment as a penalty for murder. These results show a more divided public than last year, when the comparable figures were 53% to 44%, respectively.
| Which Is the Better Penalty for Murder -- the Death Penalty or Life Imprisonment? |
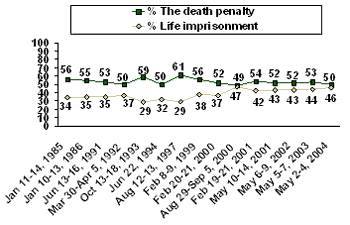 |
Over the past 20 years, support for the death penalty instead of life imprisonment has fluctuated between a low of 49% and a high of 61%. The latter figure was measured in August 1997, just before McVeigh's death sentence was formally handed down.
Support for life imprisonment instead of the death penalty has been higher over the past several years than it was from 1985 to 2000. Typically during that time, about a third or more Americans preferred life imprisonment as a penalty for murder, but in the past four years, the percentage has varied in the low- to mid-40% range.
When Gallup first began asking about the death penalty in 1936, the question at that time did not specify life imprisonment as an alternative, and the same question asked today finds a substantial majority of the public supporting the death penalty. The current poll shows 71% in favor, up from 64% last October, but about the same as it was in most of 2002-2003.
| Favor or Oppose Death Penalty for Those Convicted of Murder? |
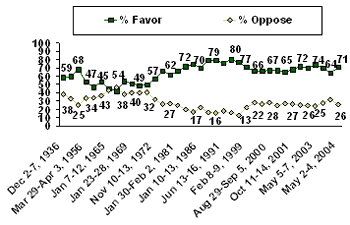 |
In the 1960s and early 1970s, when the legality of the death penalty was being challenged in the courts, Americans expressed much less support for that punishment than they did earlier and than they have since. Highest support was reached in the late 1980s and early 1990s, when about 8 in 10 Americans were in favor.
Support for the death penalty reflects the fact that most people, 65%, think it is a "morally acceptable" punishment, while only 28% think it is "morally wrong."
Next, I'm going to read you a list of issues. Regardless of whether or not you think it should be legal, for each one, please tell me whether you personally believe that in general it is morally acceptable or morally wrong. How about … [RANDOM ORDER]?
The death penalty
|
|
|
DEPENDS ON SITUATION (vol.) |
NOT A |
|
|
|
% |
% |
% |
% |
% |
|
|
2004 May 2-4 |
65 |
28 |
4 |
1 |
2 |
|
2003 May 5-7 |
64 |
31 |
4 |
-- |
1 |
|
2002 May 6-9 |
65 |
28 |
5 |
* |
2 |
|
2001 May 10-14 |
63 |
27 |
7 |
1 |
2 |
|
(vol.) Volunteered response |
|||||
|
* Less than 0.5% |
|||||
Consistent with support for the death penalty, about half of all Americans, 48%, believe execution is not imposed frequently enough, while just 23% say it is imposed too often and 25% say it is imposed the right amount.
| Is the Death Penalty Imposed Too Often, About the Right Amount, or Not Often Enough? |
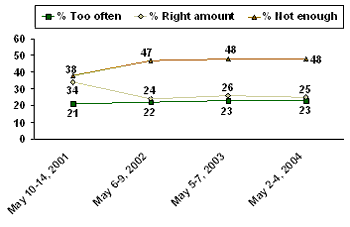 |
These views have changed little over the past two years. The public became somewhat more supportive of the death penalty after the 9/11 terrorist attacks: The percentage saying the punishment was not imposed enough increased by 9 percentage points (from 38% in May 2001 to 47% in May 2002), and the number saying the death penalty was imposed the right amount declined by 10 points over the same period of time (from 34% to 24%).
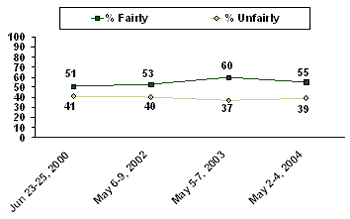
Despite news reports in the past couple of years about mistaken convictions, as revealed by new DNA tests, the public remains mostly confident that the death penalty is applied fairly -- 55% say it is, while 39% say it is not.
| Is the Death Penalty Applied Fairly or Unfairly in This Country Today? |
 |
Most Americans, 62%, believe the death penalty is not a deterrent to murder, while only 35% say it is a deterrent.
| Is the Death Penalty a Deterrent to the Commitment of Murder? |
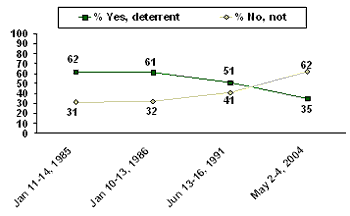 |
The current results represent a significant change from what people thought in 1991, when a Gallup Poll showed that 51% of Americans thought the death penalty was a deterrent. In the mid-1980s, about 6 in 10 thought it was a deterrent.
The deterrence issue seems to have only a modest effect on supporters' attitudes toward the death penalty, however. Among people who say it is a deterrent, 69% would still support it even if it could be proved the death penalty did not lower the murder rate.
Suppose new evidence showed that the death penalty does not act as a deterrent to murder, that is does not lower the murder rate. Would you favor or oppose the death penalty?
BASED ON 366 ADULTS WHO SAY THE DEATH PENALTY IS A DETERRENT TO MURDER
|
Favor |
Oppose |
No opinion |
|
|
2004 May 2-4 |
69% |
28 |
3 |
Survey Methods
Results are based on telephone interviews with 1,000 national adults, aged 18 and older, conducted May 2-4, 2004. For results based on the total sample of national adults, one can say with 95% confidence that the margin of sampling error is ±3 percentage points. In addition to sampling error, question wording and practical difficulties in conducting surveys can introduce error or bias into the findings of public opinion polls.
22. Are you in favor of the death penalty for a person convicted of murder?
BASED ON 519 NATIONAL ADULTS IN FORM A
|
|
|
No |
|
|
% |
% |
% |
|
|
2004 May 2-4 ^ |
71 |
26 |
3 |
|
2003 Oct 6-8 |
64 |
32 |
4 |
|
2003 May 19-21 |
70 |
28 |
2 |
|
2003 May 5-7 ^ |
74 |
24 |
2 |
|
2002 Oct 14-17 |
70 |
25 |
5 |
|
2002 May 6-9 ^ |
72 |
25 |
3 |
|
2001 Oct 11-14 |
68 |
26 |
6 |
|
2001 May 10-14 ^ |
65 |
27 |
8 |
|
2001 Feb 19-21 ^ |
67 |
25 |
8 |
|
2000 Aug 29-Sep 5 |
67 |
28 |
5 |
|
2000 Jun 23-25 |
66 |
26 |
8 |
|
2000 Feb 14-15 |
66 |
28 |
6 |
|
1999 Feb 8-9 |
71 |
22 |
7 |
|
1995 May 11-14 |
77 |
13 |
10 |
|
1994 Sep 6-7 |
80 |
16 |
4 |
|
1991 Jun 13-16 |
76 |
18 |
6 |
|
1988 Sep 25-Oct 1 |
79 |
16 |
5 |
|
1988 Sep 9-11 |
79 |
16 |
5 |
|
1986 Jan 10-13 |
70 |
22 |
8 |
|
1985 Nov 11-18 |
75 |
17 |
8 |
|
1985 Jan 11-14 |
72 |
20 |
8 |
|
1981 Jan 30-Feb 2 |
66 |
25 |
9 |
|
1978 Mar 3-6 |
62 |
27 |
11 |
|
1976 Apr 9-12 |
66 |
26 |
8 |
|
1972 Nov 10-13 |
57 |
32 |
11 |
|
1972 Mar 3-5 |
50 |
41 |
9 |
|
1971 Oct 29-Nov 2 |
49 |
40 |
11 |
|
1969 Jan 23-28 |
51 |
40 |
9 |
|
1967 Jun 2-7 |
54 |
38 |
8 |
|
1966 May 19-24 |
42 |
47 |
11 |
|
1965 Jan 7-12 |
45 |
43 |
12 |
|
1960 Mar 2-7 |
53 |
36 |
11 |
|
1957 Aug 29-Sep 4 |
47 |
34 |
18 |
|
1956 Mar 29-Apr 3 |
53 |
34 |
13 |
|
1953 Nov 1-5 |
68 |
25 |
7 |
|
1937 Dec 1-6 |
60 |
33 |
7 |
|
1936 Dec 2-7 |
59 |
38 |
3 |
23. If you could choose between the following two approaches, which do you think is the better penalty for murder -- [ROTATED: the death penalty (or) life imprisonment, with absolutely no possibility of parole]?
BASED ON 486 NATIONAL ADULTS IN FORM B
|
The death penalty |
Life imprisonment |
No opinion |
||
|
% |
% |
% |
||
|
2004 May 2-4 |
50 |
46 |
4 |
|
|
2003 May 5-7 |
53 |
44 |
3 |
|
|
2002 May 6-9 ^ |
52 |
43 |
5 |
|
|
2001 May 10-14 ^ |
52 |
43 |
5 |
|
|
2001 Feb 19-21 ^ |
54 |
42 |
4 |
|
|
2000 Aug 29-Sep 5 ^ |
49 |
47 |
4 |
|
|
2000 Feb 20-21 |
52 |
37 |
11 |
|
|
1999 Feb 8-9 ^ |
56 |
38 |
6 |
|
|
1997 Aug 12-13 ^ |
61 |
29 |
10 |
|
|
1994 June 22 |
50 |
32 |
18 |
|
|
1993 Oct 13-18 |
59 |
29 |
12 |
|
|
1992 Mar 30-Apr 5 |
50 |
37 |
13 |
|
|
1991 Jun 13-16 |
53 |
35 |
11 |
|
|
1986 Jan 10-13 |
55 |
35 |
10 |
|
|
1985 Jan 11-14 |
56 |
34 |
10 |
|
|
^ |
Asked of a half sample. |
|||
24. In your opinion, is the death penalty imposed -- [ROTATED: too often, about the right amount, or not often enough]?
|
Too |
About the |
Not |
No |
|
|
% |
% |
% |
% |
|
|
2004 May 2-4 |
23 |
25 |
48 |
4 |
|
2003 May 5-7 |
23 |
26 |
48 |
3 |
|
2002 May 6-9 |
22 |
24 |
47 |
7 |
|
2001 May 10-14 |
21 |
34 |
38 |
7 |
25. Generally speaking, do you believe the death penalty is applied fairly or unfairly in this country today?
|
Fairly |
Unfairly |
No opinion |
|
|
% |
% |
% |
|
|
2004 May 2-4 |
55 |
39 |
6 |
|
2003 May 5-7 |
60 |
37 |
3 |
|
2002 May 6-9 |
53 |
40 |
7 |
|
2000 Jun 23-25 |
51 |
41 |
8 |
26. Do you feel that the death penalty acts as a deterrent to the commitment of murder, that it lowers the murder rate, or not?
|
Yes, does |
No, does not |
No opinion |
|
|
% |
% |
% |
|
|
2004 May 2-4 |
35 |
62 |
3 |
|
1991 Jun 13-16 |
51 |
41 |
8 |
|
1986 Jan 10-13 |
61 |
32 |
7 |
|
1985 Jan 11-14 |
62 |
31 |
7 |
27. Suppose new evidence showed that the death penalty does not act as a deterrent to murder, that is does not lower the murder rate. Would you favor or oppose the death penalty?
BASED ON 366 ADULTS WHO SAY THE DEATH PENALTY IS A DETERRENT TO MURDER
|
Favor |
Oppose |
No opinion |
|
|
2004 May 2-4 |
69% |
28 |
3 |
28. Suppose new evidence showed that the death penalty acts as a deterrent to murder, that it lowers the murder rate. Would you favor or oppose the death penalty?
BASED ON 604 ADULTS WHO SAY THE DEATH PENALTY IS NOT A DETERRENT TO MURDER
|
Favor |
Oppose |
No opinion |
|
|
2004 May 2-4 |
65% |
31 |
4 |
