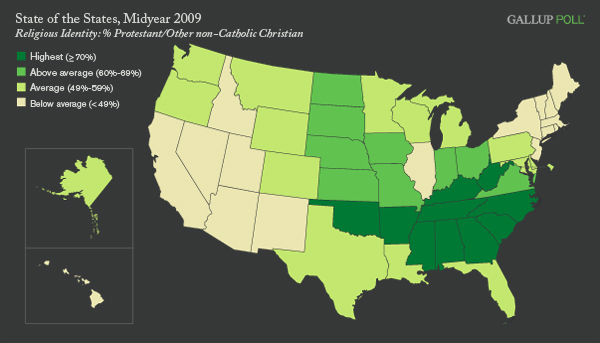
PRINCETON, NJ -- The states of the union differ remarkably from one another in terms of their residents' religions. Non-Catholic Christians -- the largest religious group in the country today -- are heavily concentrated in the South and nearby states, while constituting only a minority of residents of Northeastern states, and of many Middle Atlantic and Western states.
States that have lower percentages of non-Catholic Christians are proportionately much more heavily dominated by those of other religions, particularly Catholics, who are heavily represented in the Middle Atlantic and New England states.
Americans with no religious identity at all tend to be found most frequently in the Northeast and Northwest (plus Hawaii), while members of the Church of Jesus Christ of Latter-day Saints are most prevalent in Utah and surrounding states, and Jews in Mid-Atlantic states.
The accompanying maps give a portrait of this remarkable pattern of religious dispersion in the U.S. for these religious groups, based on a new analysis of more than 170,000 Gallup interviews conducted between January and June of this year. A good deal of the religious dispersion across the states is explainable by historical immigration patterns -- particularly the impact of the large waves of European Catholics and Jews who came through ports of entry in the Middle Atlantic states in the 19th and early 20th centuries. (The analysis does not include Muslims or other non-Christian religions due to small sample sizes.)
The geographic concentration of Mormons in and around Utah reflects the cross-country migration of that group in the mid-1800s from Illinois and other Eastern states to their new home. The fact that certain states like Oregon and Vermont consist disproportionately of residents with no religious identity is more difficult to explain, with hypotheses focusing on the particular and idiosyncratic cultures of those states and/or the migration of certain types of Americans to those states over the decades.
Protestants/Other Non-Catholic Christians
The largest religious group in America is the 54% of Americans who identify themselves as Protestants or who identify with a non-Catholic Christian religion. There are significant differences in the distribution of this group of non-Catholic Christians across the states of the union. In some states, the percentage of Protestants/other non-Catholic Christians rises to 80% or higher. In others, the percentage of those who are Catholic, some other religion, or no religion at all is so large that it drives down the percentage who are Protestant/other non-Catholic Christian to below one-third.
The proportion of non-Catholic Christians is clearly the highest in the traditional Bible Belt states of the South. In fact, all of the top 10 states in terms of proportion of non-Catholic Christians are Southern or on the fringes of the South; Mississippi and Alabama are at the top, with 81% and 80% Protestant/other Non-Catholic Christian, respectively.
The state with the lowest proportion of non-Catholic Christians is Utah. As will be seen below, the large percentage of Utah residents who are Mormon reduces all other religious categories to low representations. Other states that are low in terms of non-Catholic Christian representation are those with high percentages of Catholics, including Rhode Island, Massachusetts, Connecticut, New York, and New Jersey.
Catholics
About 24% of all American adults identified as Catholic between January and June of this year. The distribution of Catholics across the states is heavily skewed toward the New England and Mid-Atlantic states, the regions of the country through which the large waves of Catholic immigrants from Europe arrived in the 19th and 20th centuries.
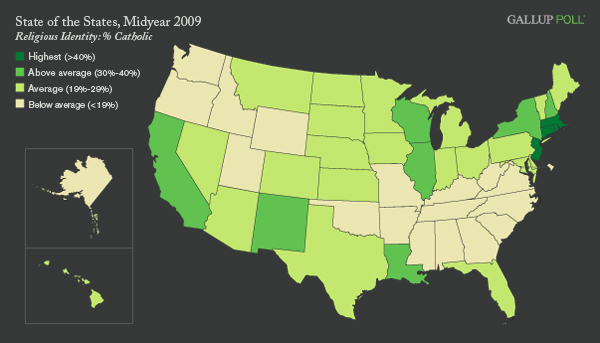
The state with highest percentage Catholic is Rhode Island, at 53%, followed by Massachusetts, Connecticut, New Jersey, and New York. Two Midwestern states, Wisconsin and Illinois, are also in the top 10 states in terms of the percentage Catholic. States with higher percentages of Hispanic residents, including California and New Mexico, are above average in the proportion of their residents who are Catholic. Louisiana, home to immigrating French Canadians (Cajuns) several centuries ago, also has an above-average Catholic population.
The 10 states with the lowest percentages of Catholics are all in or close to the South, with the exception of Utah (with its high concentration of Mormons). Mississippi, with a 6% Catholic population, has the lowest proportion of Catholics of any state.
Jews
About 2% of American adults are Jewish, and the distribution of Jews across states is skewed toward Mid-Atlantic and New England states, as well as Florida and California.
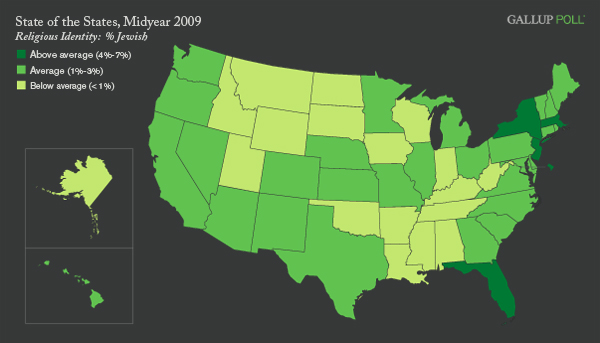
New York has the highest percentage of Jewish residents, at 7%. This figure is for the entire state of New York; the percentage Jewish in New York City is higher.
New York is followed by the District of Columbia and New Jersey, with 5% to 6% Jewish residents. Other states with a 3% or higher Jewish population are Massachusetts, Florida, Maryland, Rhode Island, California, and Connecticut.
A number of states have so few Jews that the estimate of the Jewish population rounds down to 0%. As one example, out of the 959 randomly selected adults Gallup interviewed in Montana from January to June of this year, none identified their religion as Jewish.
Latter-day Saints (Mormons)
Mormons, who make up about 2% of the U.S population, have the most extremely differentiated geographic pattern of any of the religious groups used in this analysis, with the highest concentrations, as would be expected, in and around the state of Utah. Sixty-one percent of Utah residents interviewed by Gallup identified as Mormons.
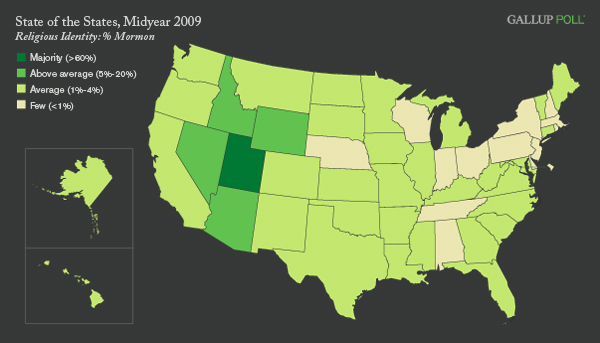
Although this is by far the highest concentration of Mormons in any state, the fact that about 4 out of 10 Utah residents are not Mormon underscores that Utah has a more diverse religious population than has been the case in previous decades, and certainly in the 19th century, when Brigham Young brought his band of religious followers across the country to settle in the territory that later became Utah.
Idaho and Wyoming -- both contiguous to Utah -- have 19% and 10% Mormon populations, respectively, while two other states contiguous to Utah also have above-average percentages of Mormons -- Arizona at 6% and Nevada at 5%. A number of states, mostly in the Midwest and East, have less than a 1% Mormon population.
No Religious Identity
As was the case in a state-by-state analysis of the percentage of Americans saying religion is important in their daily lives, the states with the highest percentage of adult residents saying they have no religious identity are in the Northeast and the Northwest regions of the country.
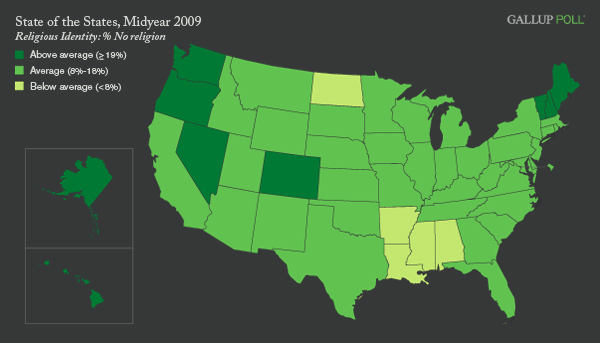
Oregon tops the list, with 25% of its residents claiming no particular religious identity, followed closely by Vermont at 24%. Other states with at least 20% "no religion" are Washington, Alaska, New Hampshire, Hawaii, and Maine.
At the other end of the spectrum, the most religious states in the union, based on the lowest percentages of those saying they have no religion, are Mississippi, where only 6% do not have a religion, followed by Alabama, Arkansas, North Dakota, and Louisiana.
Gallup.com's "State of the States" series reveals state-by-state differences on political, economic, and wellbeing measures Gallup tracks each day, based on data collected between January and June 2009. To see all stories published in the midyear 2009 series, click here. New stories will be released throughout the month of August.
Survey Methods
Results are based on telephone interviews with 178,543 national adults, aged 18 and older, conducted Jan. 2-June 30, 2009, as part of Gallup Poll Daily tracking. For results based on the total sample of national adults, one can say with 95% confidence that the maximum margin of sampling error is ±1 percentage points.
The margin of sampling error for most states is ±3 percentage points, but is as high as ±7 percentage points for the District of Columbia, and ±6 percentage points for Wyoming, North Dakota, South Dakota, Delaware, and Hawaii.
Interviews are conducted with respondents on land-line telephones (for respondents with a land-line telephone) and cellular phones (for respondents who are cell-phone only).
In addition to sampling error, question wording and practical difficulties in conducting surveys can introduce error or bias into the findings of public opinion polls.
