WASHINGTON, D.C. -- Residents of Colorado, Hawaii, and Utah in the first half of 2009 were the least likely to be obese, while Mississippi, West Virginia, Alaska, and Arkansas residents were the most likely. The incidence of obese people runs nearly eight percentage points higher, on average, in the 10 most obese states compared with the 10 least obese states (30.5% vs. 22.7%, respectively).
The midyear results for the Gallup-Healthways Well-Being Index (from January through June 2009) find obesity in the U.S. increasing to 26.6% in the first half of 2009 from 25.5% in all of 2008. (This is based on respondents' self-reports of their height and weight, which are then used to calculate standard Body Mass Index scores. Individual BMI values of 30 or above are classified as "obese.")
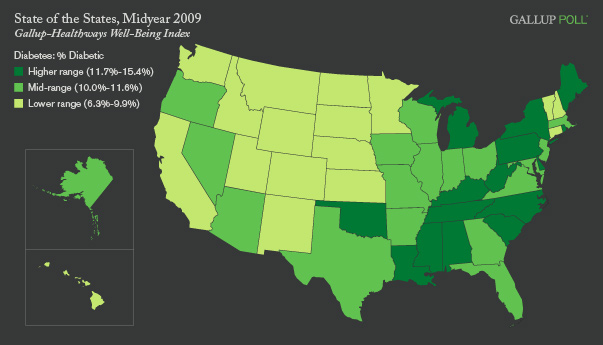
Following from the elevated rates of obesity, diabetes incidence has also shown a small but meaningful increase since 2008, with 11.0% of respondents nationwide thus far in 2009 acknowledging that they have been diagnosed with the disease, compared to 10.6% in all of last year.
The relationship between obesity and diabetes-related health outcomes is widely understood, and is confirmed by the Gallup-Healthways data, with an average diabetes rate of 9.1% in the 10 least obese states, compared to an average diabetes rate of 12.2% in the 10 most obese states (which includes an 11th state due to a three-way tie for 9th place). If the 10 most obese states had the same obesity rate as the 10 least obese, approximately 4.6 million fewer people would be obese and an estimated 1.8 million fewer would be diagnosed with diabetes in those 10 states alone. Underscoring the point, if all 50 states had the same average diabetes rate as the 10 least obese states, approximately 5 million fewer Americans would be diabetics.
West Virginia, Mississippi, Alabama, South Carolina, and Tennessee are the five states with the highest reported diabetes rates. Four of these five are also among the most obese in the nation. (Kentucky and Louisiana are also on both the 10 Most Obese and 10 Highest Diabetes lists.) North Dakota, Colorado, Utah, Montana, and Wyoming are the five states with the lowest incidence of diabetes. Again, substantial overlap exists between the low diabetes states and the low obesity states.
As seen in the accompanying maps, most states in the Mountain West, West, and Northeast (for obesity) tend to fare better in terms of diabetes and obesity than those in the South. The Midwest is more of a mixture, as is the Northeast for diabetes.
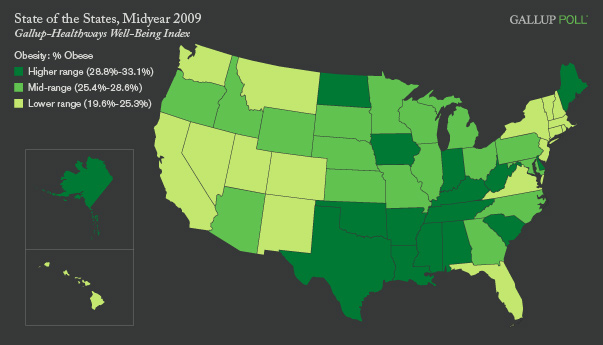
Thus far in 2009, Wyoming, Alaska, Minnesota, and Maine have had the greatest self-reported increases in obesity (via the Body Mass Index) compared to last year, all representing substantive increases even when accompanying error ranges found in the samples are accounted for.
Diabetes, too, is up in a number of states so far in 2009. While an error range exists around each state's percentages, Maine, Rhode Island, Oregon, South Carolina, and Tennessee have all seen small but meaningful increases in the rate of diabetes since 2008.
In fact, when all 50 states are sorted into two groups according to change in obesity relative to 2008, the 25 states that have shown the greatest increases in obesity have had an average increase of 0.5 percentage points in diabetes, compared to a 0.2 percentage-point increase in diabetes among the 25 states with the lowest increases, or with slight decreases, in obesity.
The Gallup-Healthways Well-Being Index data on obesity and diabetes are subcomponents of the Physical Health Sub-Index, on which North Dakota and West Virginia, the best and worst states, respectively, in terms of diabetes, also rank best and worst respectively for overall physical health. The Physical Health Sub-Index is one of six domains used to calculate a state's overall wellbeing score.
Learn more about the Gallup-Healthways Well-Being Index.
Gallup.com's "State of the States" series reveals state-by-state differences on political, economic, and wellbeing measures Gallup tracks each day, based on data collected between January and June 2009. To see all stories published in the midyear 2009 series, click here. New stories will be released throughout the month of August.
Survey Methods
Results are based on telephone interviews with 178,545 national adults, aged 18 and older, conducted Jan. 2-June 30, 2009, as part of the Gallup-Healthways Well-Being Index. For results based on the total sample of national adults, one can say with 95% confidence that the maximum margin of sampling error is ±0.2 percentage points.
The margin of sampling error for most states is ±1-2 percentage points, but is as high as ±4 percentage points for smaller states such as Wyoming, North Dakota, South Dakota, Delaware and Hawaii.
Interviews are conducted with respondents on land-line telephones (for respondents with a land-line telephone) and cellular phones (for respondents who are cell-phone only).
In addition to sampling error, question wording and practical difficulties in conducting surveys can introduce error or bias into the findings of public opinion polls.