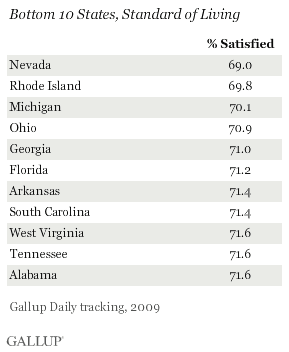
PRINCETON, NJ -- On a state-by-state basis, U.S. adults' average satisfaction in 2009 with their own standard of living -- that is, "all the things you can buy and do" -- fell in a fairly narrow range, from 82.3% in North Dakota at the high end to 69% in Nevada at the low end.


"Satisfaction in Mississippi, Delaware, and North Dakota increased by more than five percentage points between 2008 and 2009, and in Connecticut, Maine, and New York it increased by more than four points."
Geographically, the states that were home to residents with the highest levels of satisfaction with their standard of living (77% or greater) in 2009 are concentrated in the Midwest and Rocky Mountain regions, plus Alaska, Hawaii, and Virginia. Of the four least satisfied (all with satisfaction scores below 71%), two are in the ailing Rust Belt (Ohio and Michigan); the others are economically troubled Nevada and Rhode Island.
The 2009 satisfaction results are based on combined data for Gallup Daily tracking from Jan. 2 through Dec. 30, 2009, including more than 350,000 interviews for the entire year. The state sample sizes range from 632 in the District of Columbia and 878 in Wyoming to 37,203 in California. Forty-one states had more than 2,000 respondents.
Several states showed a small, but statistically meaningful, improvement in satisfaction with their standard of living in the past year. Satisfaction in Mississippi, Delaware, and North Dakota increased by more than five percentage points between 2008 and 2009, and in Connecticut, Maine, and New York it increased by more than four points.
Overall, 31 states showed an increase in satisfaction of at least one percentage point between 2008 and 2009, whereas 5 showed a decrease of at least one point (the greatest decrease, Hawaii's, was less than four points.) The remaining 14 states plus the District of Columbia changed by less than one point.

Standard of Living Reviews Don't Entirely Match Economic Confidence
The public's broad satisfaction with its standard of living in 2009 contrasts with state residents' uniformly pessimistic views of national economic conditions (ranging from -16 to -47).
In terms of rankings, there is a fair amount of consistency between states whose residents hold the most positive perceptions of their standard of living and states with the least negative perceptions of the economy. The reverse is also true -- those highly negative (or less positive) on one measure tend to be among the most negative on the other. However, there are several major exceptions to this.
-
Two of the states reporting the highest levels of satisfaction with their standard of living -- Montana (78.0%) and Idaho (77.6%) -- had among the least positive outlooks on the U.S. economy last year (with Gallup Economic Confidence Index values of -38 and -42, respectively).
-
Conversely, South Carolina (71.4%) and Georgia (71.0%) were among the least satisfied with their standard of living, but registered about average levels of economic confidence.
Additionally, Hawaii, Wyoming, Maine, Pennsylvania, and Arizona all rank much higher among the states according to satisfaction with standard of living than they do on the basis of economic confidence. Mississippi, New Jersey, New York, Louisiana, the District of Columbia, and North Carolina all rank significantly lower on satisfaction with standard of living than they do on economic confidence.

Bottom Line
Despite the many serious economic problems facing the country in 2009 -- and consumers' resulting pessimism about the economy -- the great majority of residents of every state were upbeat about their own standard of living last year. This still left nearly 30% of Americans dissatisfied in many states, highlighting the clear need for improvement. However, in most states the 2009 readings were slightly improved over 2008.
Gallup's "State of the States" series reveals state-by-state differences on political, economic, and wellbeing measures Gallup tracks each day. New stories will be released throughout the month of February.
Survey Methods
Results are based on telephone interviews with 353,848 national adults, aged 18 and older, conducted Jan. 2-Dec. 30, 2009, as part of Gallup Daily tracking. For results based on the total sample of national adults, one can say with 95% confidence that the maximum margin of sampling error is ±1 percentage point.
The margin of error for most states is ±2 percentage points, but is as high as ±5 percentage points for the District of Columbia. For the most populous states, the margin of error is ±1 percentage point.
Interviews are conducted with respondents on land-line telephones and cellular phones.
In addition to sampling error, question wording and practical difficulties in conducting surveys can introduce error or bias into the findings of public opinion polls.
