Gallup's tracking of the following indicators provides key insights into the factors that have proven to help predict and explain the outcomes of congressional midterm elections.
Generic Ballot for Congress
Gallup's generic congressional ballot provides a summary measure of Americans' current voting intentions for Congress. The generic ballot has proven to be a highly accurate predictor of the national vote for the House of Representatives in midterm election years.
In terms of analyzing the generic ballot for clues as to which party has the advantage well before an election, the size of the lead among registered voters offers arguably more insight than the simple fact of which party is ahead. Given the usual Democratic advantages in party identification among the general public, it is rare for Republicans to lead on the generic ballot among registered voters. This was the case even when Republicans were the majority congressional party from the mid-1990s to the mid-2000s.
But the reason the Republican Party is competitive in congressional elections is that Republicans generally turn out to vote at higher rates than Democrats. Turnout is crucial in midterm elections, and with at least 80% of Americans registered to vote but only about half that number likely to vote in the midterm elections, registered voter and actual voter preferences can differ by a lot.
As a starting point in determining which party has the advantage, if Democrats have close to a double-digit lead among registered voters, they are virtually ensured of also having a lead among actual voters -- whatever turnout happens to be on Election Day.
From that point, things become a little less clear-cut. Smaller Democratic leads do not necessarily mean the party is losing the race to control the House, but rather that the eventual election outcome will be more dependent on turnout. In general, the closer the registered voter results get to an even split, the better Republicans can expect to do, given usual turnout patterns.
Gallup projects turnout patterns in a given election by applying its "likely voter" model to midterm poll results. However, since it is unclear how reliable this model is in identifying likely voters in a low-turnout election long before Election Day, Gallup usually does not begin to estimate likely voter preferences until September or October of a midterm election year. Still, early generic-ballot results based on the sample of registered voters do give reliable -- if not highly precise -- indications of how the election might go.
For example, through much of 1974, 1982, and 2006 -- highly successful years for the Democratic Party -- the generic ballot showed consistent, huge Democratic advantages among registered voters.
In 1994, leading up to a Republican landslide, the generic ballot suggested it could be a very promising year for Republicans, as the party actually enjoyed a slight lead among registered voters in several polls. When the likely voter models were applied in the final months of the campaign, Republicans held solid leads among this group of voters.
In years such as 1998 and 2002, the early reads on the generic ballot suggested the elections would be competitive, and the eventual outcome would largely depend on turnout. Those two elections were unique from the standpoint that the president's party (Democratic in 1998 and Republican in 2002) gained U.S. House seats in the midterm elections, bucking the historical trend. Turnout proved to be pivotal in 2002, as the Democrats' five-point lead among registered voters turned into a six-point deficit once likely voter preferences were measured (the actual vote on Election Day showed a five-point Republican advantage).
Enthusiasm About Voting
Gallup has found a relationship between expressed enthusiasm about voting and the outcomes of midterm elections. Generally speaking, the party whose identifiers show an advantage on voting enthusiasm tends to fare better on Election Day. For example, Republicans had enthusiasm advantages in 1994 and 2002, while Democrats had an advantage in 2006. In 1998, a very close election, neither party had an apparent advantage.
In theory, those who are engaged in an election are more likely to turn out. And this may be true at the individual level. However, Gallup has not found a direct relationship between enthusiasm among party groups and higher turnout among those groups. Thus, the effect of enthusiasm may be more indirect on voting. Specifically, Gallup has found increases in the percentage of Americans identifying with the party that holds an enthusiasm advantage in an election year from the prior year. Given the strong relationship between party identification and voting for Congress, an increase in party identification is likely to lead to a higher vote for that party in an election.
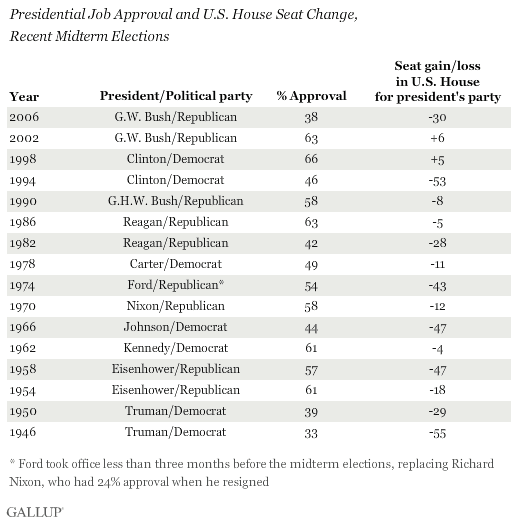
It is well-documented that the president's party is usually vulnerable to losing congressional seats in midterm elections, though there have been exceptions, such as in the 1998 and 2002 elections. Unpopular presidents tend to suffer greater losses, and popular presidents are able to minimize these or even help achieve gains. George W. Bush experienced both outcomes, with Republican gains in 2002 when he was popular and heavy Republican losses in 2006 when he was not.
The Democrats will contest the 2010 elections with their fellow partisan, Barack Obama, in the White House. Obama's approval ratings are currently middling, suggesting he would not be able to minimize Democratic losses to a great degree if the elections were held today. Further erosion of Obama's popularity between now and November could prove damaging to the Democratic Party's chances to retain control of the House. First-term presidents who had sub-50% approval ratings at the midterms -- including Harry Truman, Lyndon Johnson, Jimmy Carter, Ronald Reagan, and Bill Clinton -- saw their parties suffer large congressional seat losses. In contrast, a recovery in Obama's approval rating -- particularly to above 60% -- could limit Democratic losses.

Congressional Job Approval
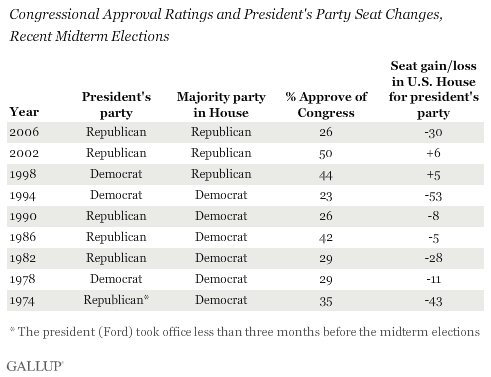
Often in recent decades, one party has occupied the White House and the other has controlled Congress, somewhat blurring the degree to which either party can be held accountable for the state of the nation in midterm elections. Generally, it appears the president's party is more important to voters, with that party losing seats in seven of the last nine midterm elections. By contrast, the majority party in Congress has lost seats in four of the last nine midterms.
But Congress' performance is hardly irrelevant to voters. Low congressional approval ratings have been associated with greater congressional seat turnover in midterm elections and higher approval ratings with less change, regardless of which party controls the legislative branch. The magic number appears to be a 40% approval rating for Congress, with seat losses minimized when approval exceeds that level and seat losses generally large when approval is below that figure.

Satisfaction With the Way Things Are Going in the Country
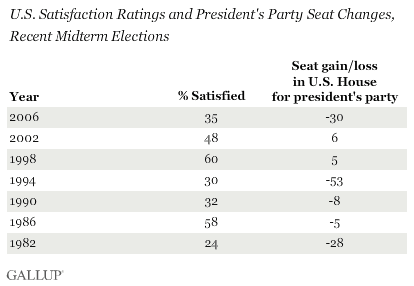
This rating, similar to the right track/wrong track measures other polling organizations ask, is less overtly political than presidential job approval, but has a similar relationship to election outcomes. Lower satisfaction levels -- which usually reflect Americans' assessment of the current political and economic situation -- are associated with poorer performances for the president's party in midterm elections.
Presidential approval ratings and satisfaction are usually related, but there is at least one example when they diverged in a midterm election year. In 1990, the Republican Party was able to overcome a low satisfaction rating (32%) to achieve a relatively strong election showing, likely due to the popularity of President George H.W. Bush (58% approval) at the time. Thus, presidential approval is probably the more consequential of the two measures.

