PRINCETON, NJ -- More states are politically competitive this year than was the case in 2009, as fewer Americans nationwide identify with the Democratic Party. Vermont -- along with the District of Columbia -- is the most Democratic state in the U.S. in 2010 so far, while Utah, Wyoming, and Idaho are the most Republican.
These results are based on interviews with more than 175,000 U.S. adults, conducted between January and June 2010 as part of Gallup Daily tracking.
The accompanying map shows each state's relative party strength in the first half of 2010. States in which one of the parties enjoys at least a 10 percentage-point advantage in leaned identification are considered solid supporters of that party. States in which a party has between a five- and a nine-point advantage are considered leaning toward that party, and states with less than a five-point advantage for one of the parties are considered competitive.
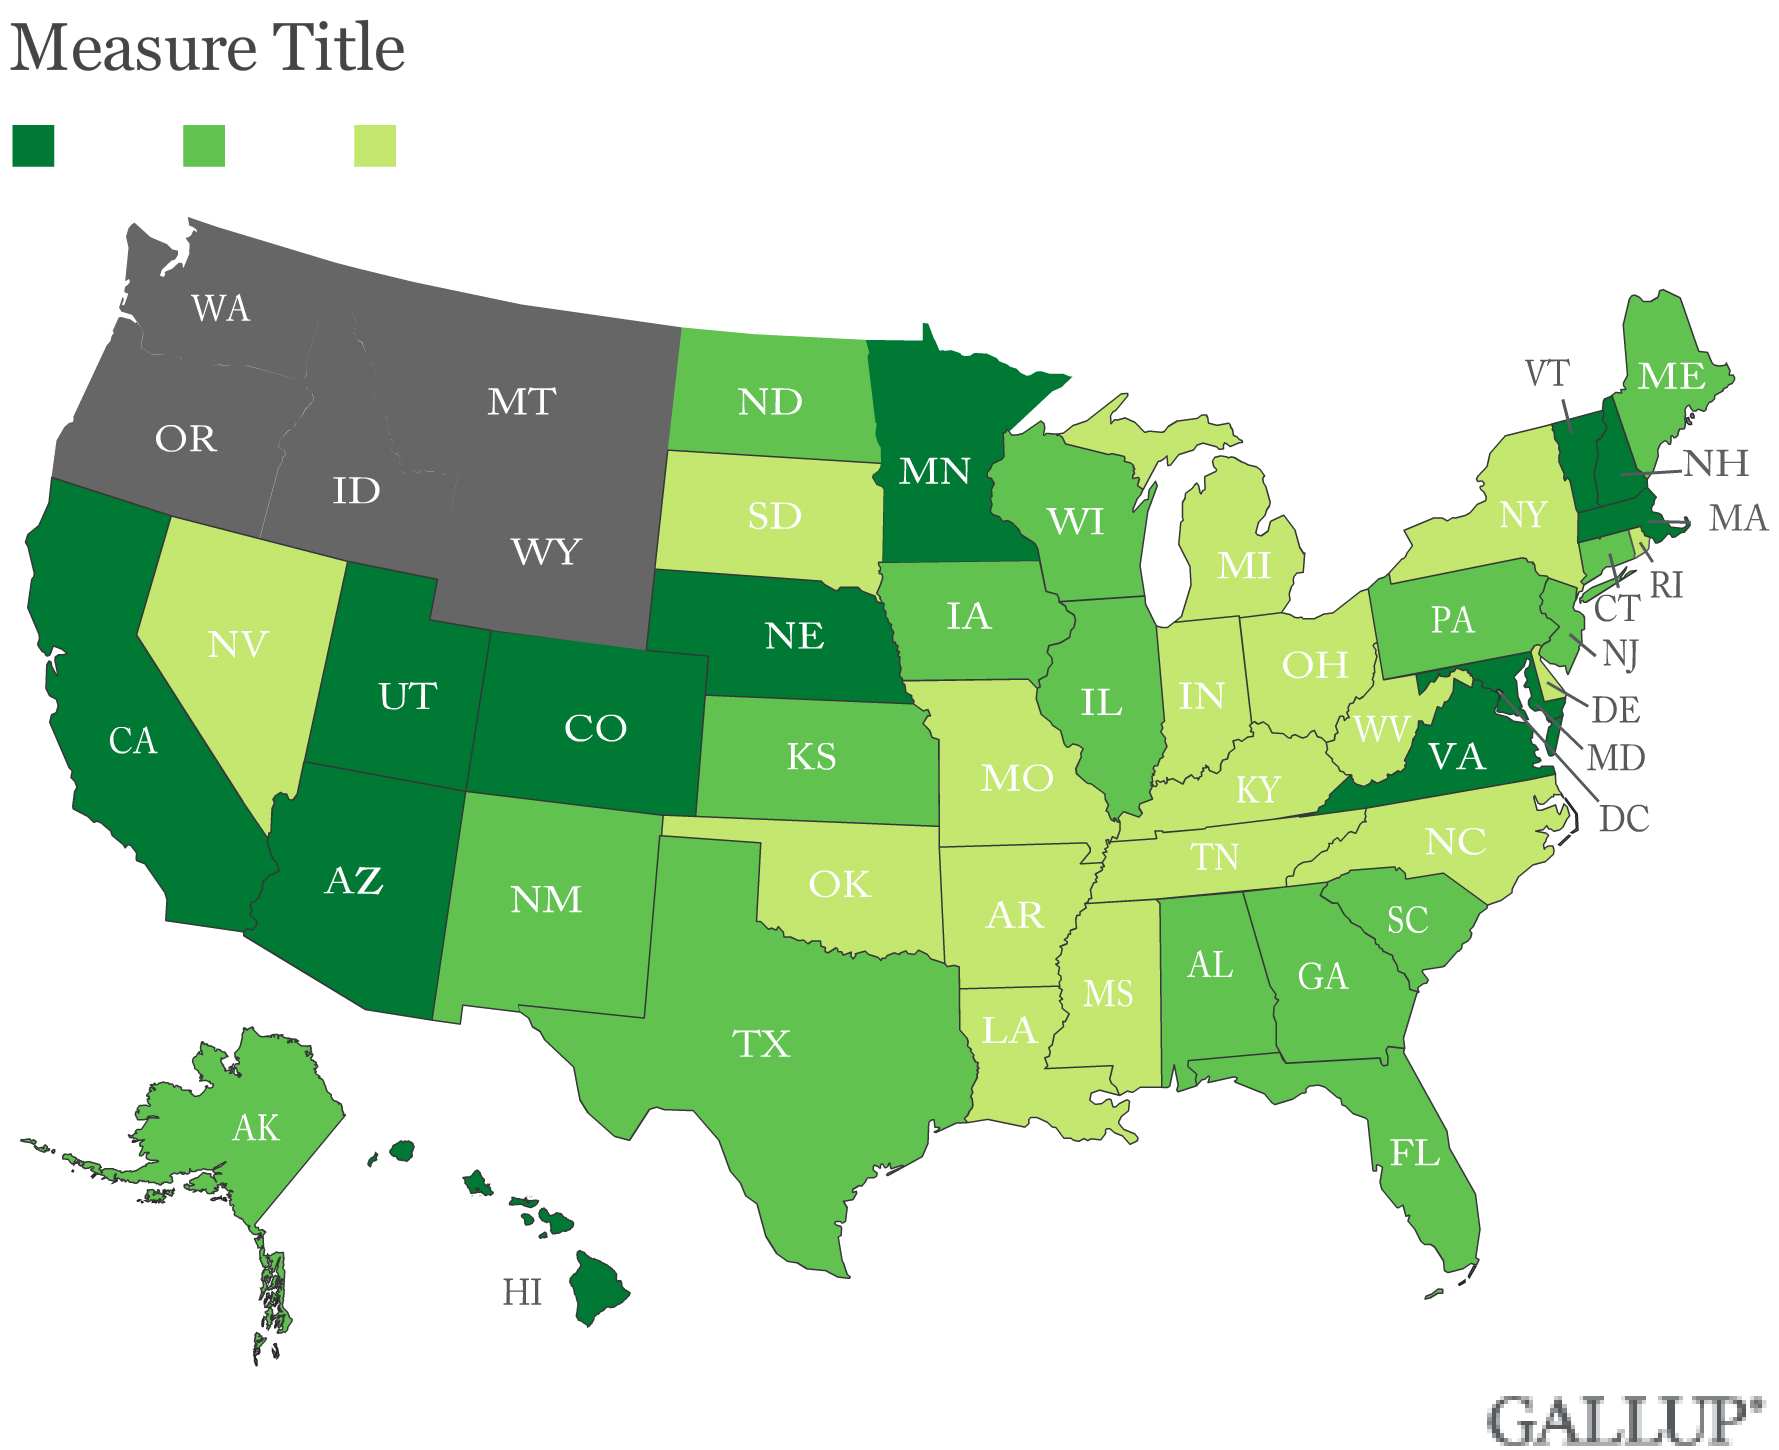
Solidly Democratic states tend to cluster in the Northeast and Mid-Atlantic, with a few exceptions in the far West (California, Hawaii, and Oregon), one in the Midwest (Illinois), and one in the Southwest (New Mexico). Solidly Republican states are all West of the Mississippi, including Alaska and states in the Mountain West (Utah, Wyoming, Idaho, and Montana) and the Midwest (Nebraska and Kansas).
The most politically competitive states in the Union, all of which have Democratic-Republican gaps of less than one point, are Colorado, Mississippi, Missouri, and Virginia.
There are 10 fewer states in the solid Democratic category thus far in 2010 than there were in 2009, and one fewer state in the leaning Democratic category. At the same time, there are three more solid Republican states, and four more in the leaning Republican category. Sixteen states can be classified as competitive, four more than last year.
It is important to note that the classification of states reported here is based on the political affiliations of all residents, and does not necessarily match the party preferences of registered voters or indicate how a state might vote in a given election. Also, the partisanship figures include independents who have a partisan leaning along with each party's core identifiers. This makes the states more comparable because the percentage of independents varies widely by state, and can understate a party's true strength in a state.
National Democratic Advantage in Party Identification Narrows
Nationwide, Democrats have a 4-point party identification advantage over Republicans in 2010 (44% to 40%), down from an 8-point advantage in 2009 and a 12-point advantage in 2008.
While Democrats' party strength fell in each of the last two years, Republicans have not gained concomitantly. Instead, the percentage of Americans who do not identify with or lean toward either political party has increased.
Bottom Line
Democrats' advantage in party identification continues to dwindle this year. Fewer Americans identify as Democrats, and more say they don't identify with or lean toward either party. On a state-by-state level, this means more states are now classified as competitive or leaning/solidly Republican than has been the case over the past two years, and fewer as leaning/solidly Democratic.
Some shift toward independent party identification is to be expected in the years between presidential elections; in presidential election years, party allegiance tends to be at its height. The key finding at this juncture is that Democrats, not Republicans, have been the net losers as Americans shift away from the major parties.
The overall result is a more competitive partisan environment this year than has been the case in the last two years, underscoring the potential for Republicans to do well and pick up seats in this year's midterm elections.
This story is part of a series of midyear updates on Gallup's State of the States data, to be released in July and August on Gallup.com. See the complete schedule and send your suggestion for our "readers' pick." Gallup.com will report new full-year totals in early 2011 based on all 2010 surveys.
Survey Methods
Results are based on telephone interviews conducted Jan. 2-June 30, 2010, as part of Gallup Daily tracking, with a random sample of 176,545 adults, aged 18 and older, living in all 50 U.S. states and the District of Columbia, selected using random-digit-dial sampling.
For results based on the total sample of national adults, one can say with 95% confidence that the maximum margin of sampling error is ±1 percentage point.
Interviews are conducted with respondents on landline telephones and cellular phones, with interviews conducted in Spanish for respondents who are primarily Spanish-speaking. Each daily sample includes a minimum quota of 150 cell phone respondents and 850 landline respondents, with additional minimum quotas among landline respondents for gender within region. Landline respondents are chosen at random within each household on the basis of which member had the most recent birthday.
Samples are weighted by gender, age, race, Hispanic ethnicity, education, region, adults in the household, cell phone-only status, cell phone-mostly status, and phone lines. Demographic weighting targets are based on the March 2009 Current Population Survey figures for the aged 18 and older non-institutionalized population living in U.S. telephone households. All reported margins of sampling error include the computed design effects for weighting and sample design.
In addition to sampling error, question wording and practical difficulties in conducting surveys can introduce error or bias into the findings of public opinion polls.
For more details on Gallup's polling methodology, visit www.gallup.com.