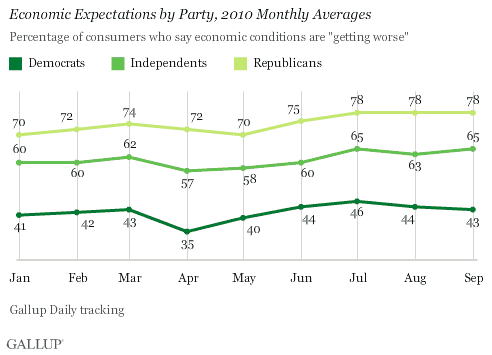
PRINCETON, NJ -- Gallup's Economic Confidence Index in September found 65% of independents saying the economy is "getting worse," tying July's reading for their highest pessimism of the year, and similar to August. Independents' views of the economy align much more closely with Republicans' than with Democrats', and are worse than they were a year ago, when 58% said the economy was getting worse.

Democrats are substantially less pessimistic than independents, with 43% currently saying things are "getting worse" -- slightly better than the 46% who felt this way in July, and about the same as in August. Republicans are substantially more pessimistic, with 78% saying the economy is getting worse -- the same as in July and August.
Half of Independents Rate the U.S. Economy "Poor"
Currently, 50% of independents rate current economic conditions in the country as "poor," slightly more than did so over the summer, but on par with the first quarter of the year and the last quarter of 2009. Here again, independents' views look much more like Republicans' than Democrats'.

At 55%, Republicans are only slightly more negative than independents about current economic conditions, and views of the two groups during 2010 have followed a similar trajectory. Republicans' current views are not too different from their views in July (52%) and August (54%), but much worse than in September 2009 (44%). Substantially fewer Democrats rate the current economy "poor" (36%) -- on par with the prior two months but slightly less than a year ago (39%).
Economic Confidence Remains at Worst Levels of 2010
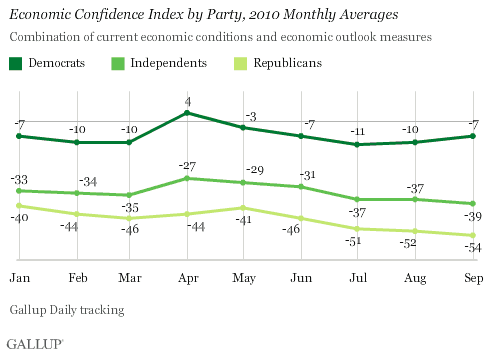
Gallup's Economic Confidence Index combines these two consumer ratings: current economic conditions (the percentage who say conditions are excellent or good minus the percentage who say they are poor) and economic outlook (the percentage who say the economy is getting better minus the percentage saying it is getting worse). During September, the index was -39 among independents, compared with -37 in each of the prior two months. This is the worst level of 2010 and reflects considerably more pessimism about the economy than the -31 of a year ago.

Here again, Republicans, at -54, are more pessimistic than independents, while Democrats, at -7, are much less pessimistic.
Early October Provides Some Added Optimism
While Democrats have remained less pessimistic than their Republican counterparts, with independents in between the two, the trends among the three groups have been similar. Economic confidence improved early in the year, with Americans of every party providing better ratings in April and May, as hope for a strong economic recovery gained adherents. Similarly, the situation deteriorated across the political spectrum during the summer, with confidence now standing substantially below where it was in April. This suggests a difficult election environment for most incumbents, particularly given the high degree of economic pessimism among independents.
However, Gallup's Economic Confidence Index has improved slightly to -31 and -29 in the weeks ending Oct. 3 and Oct. 10, respectively. In turn, this suggests that when the preliminary Reuters/University of Michigan Consumer Sentiment Index is released on Friday, it will show a slight improvement.
Over the past couple of weeks, the perception seems to be taking hold on Wall Street that things are going to get better after the midterm elections, no matter what happens. If the economy gets worse during the coming weeks and months, the Federal Reserve seems likely to try to improve things by inserting another massive dose of liquidity into the system -- the so-called quantitative easing two. If the economy improves on its own, of course, that is even better. Either way, many on Wall Street see the economic outlook getting better for investors after the midterm elections and the Fed's November meeting. A little such optimism on Wall Street could be spreading to Main Street in early October.
Alternatively, perhaps some Americans are getting less pessimistic about the economy's direction because they feel that the economic outlook will become clearer after the midterm elections. Regardless, Gallup Daily tracking will clarify whether this early October improvement in economic confidence is a short-term blip or something more substantial.
Gallup.com reports results from these indexes in daily, weekly, and monthly averages and in Gallup.com stories. Complete trend data are always available to view and export in the following charts:
Daily: Employment, Economic Confidence and Job Creation, Consumer Spending
Weekly: Employment, Economic Confidence, Job Creation, Consumer Spending
Read more about Gallup's economic measures.
For Gallup Daily tracking, Gallup interviews approximately 1,000 national adults, aged 18 and older, each day. The Gallup economic confidence results are based on random half-samples of approximately 500 national adults, aged 18 and older, each day. Weekly results are based on telephone interviews with approximately 3,000 adults.
For these results, one can say with 95% confidence that the maximum margin of sampling error is ±3 percentage points.
Interviews are conducted with respondents on landline telephones and cellular phones, with interviews conducted in Spanish for respondents who are primarily Spanish-speaking. Each daily sample includes a minimum quota of 150 cell phone respondents and 850 landline respondents, with additional minimum quotas among landline respondents for gender within region. Landline respondents are chosen at random within each household on the basis of which member had the most recent birthday.
Samples are weighted by gender, age, race, Hispanic ethnicity, education, region, adults in the household, cell phone-only status, cell phone-mostly status, and phone lines. Demographic weighting targets are based on the March 2009 Current Population Survey figures for the aged 18 and older non-institutionalized population living in U.S. telephone households. All reported margins of sampling error include the computed design effects for weighting and sample design.
In addition to sampling error, question wording and practical difficulties in conducting surveys can introduce error or bias into the findings of public opinion polls.
For more details on Gallup's polling methodology, visit www.gallup.com.
