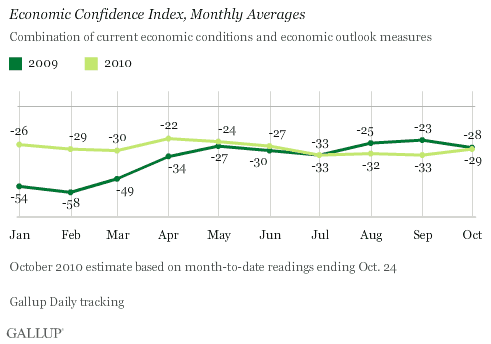
PRINCETON, NJ -- Gallup's Economic Confidence Index averaged -29 over the first four weeks of October -- an improvement from -33 in September and from similar July and August readings. However, Americans' optimism about the U.S. economy going forward is slightly worse today than it was at this time a year ago.

The Economic Confidence Index consists of two sets of U.S. consumer ratings: one involving perceptions of current economic conditions and the other involving economic outlook.
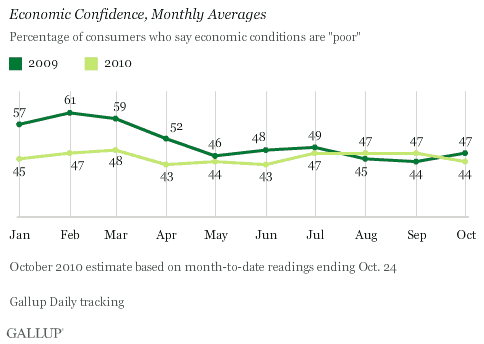
The October improvement in the Economic Confidence Index is driven largely by an uptick in Americans' ratings of current economic conditions. Over the first four weeks of October, 44% of Americans called current economic conditions "poor" -- versus the 47% average of the prior three months.

Consumers' ratings of current economic conditions, as reflected by their "poor" ratings, are slightly less negative now than they were during October 2009, when they averaged -47.
Percentage Saying the Economy "Getting Worse" Essentially Flat
Over the first four weeks of October, 60% of consumers said economic conditions are "getting worse" -- essentially the same as the 62% of September. These future expectations for the economy are slightly worse than the 57% average of October 2009.

Americans a Little Less Pessimistic in October
The improvement in Gallup's Economic Confidence Index during the first four weeks of October implies that the Conference Board's Consumer Confidence Index -- which in September fell to its lowest level since the beginning of the year -- is likely to show an increase in October when announced on Tuesday. Similarly, Friday's Reuters/University of Michigan Consumer Sentiment Index is also likely to show improvement from its September final and mid-October levels. Of course, the small sample size of the Consumer Sentiment Index survey always makes estimating movements in this Index somewhat challenging.
It seems that the positive September stock performance on Wall Street and continued increases this month may be lifting the spirits of at least some Americans. While most Americans may not be focused on the Federal Reserve's clear indications of additional quantitative easing, it seems obvious to many who are doing so that the Fed intends to do all it can to stimulate the U.S. economy and job creation.
The midterm elections may also be playing a role in Americans' confidence in the U.S. economy, although what that role may be is unclear. Much of the discussion on both sides of the political spectrum has been on economic issues, and Gallup's economic confidence data show slight improvements across party lines.
As noted earlier, expectations for the economy are essentially the same as they were in September, and slightly worse than they were a year ago.
Gallup's initial measure of consumer Christmas spending intentions suggests that the nation's retailers face another anemic holiday spending season this year. Despite its modest improvement in October, consumer confidence provides no basis for expecting much improvement at this point in time.
Gallup.com reports results from these indexes in daily, weekly, and monthly averages and in Gallup.com stories. Complete trend data are always available to view and export in the following charts:
Daily: Employment, Economic Confidence and Job Creation, Consumer Spending
Weekly: Employment, Economic Confidence, Job Creation, Consumer Spending
Read more about Gallup's economic measures.
Results are based on telephone interviews conducted as part of Gallup Daily tracking during the four weeks ending Oct. 24, 2010, with random samples averaging about 3,000 or more adults, aged 18 and older, living in all 50 U.S. states and the District of Columbia, selected using random-digit-dial sampling.
For results based on the total weekly sample of national adults, one can say with 95% confidence that the maximum margin of sampling error is ±3 percentage points. For results based on the total monthly sample of more than 15,000 national adults, one can say with 95% confidence that the maximum margin of sampling error is ±1 percentage point.
Interviews are conducted with respondents on landline telephones and cellular phones, with interviews conducted in Spanish for respondents who are primarily Spanish-speaking. Each daily sample includes a minimum quota of 150 cell phone respondents and 850 landline respondents, with additional minimum quotas among landline respondents for gender within region. Landline respondents are chosen at random within each household on the basis of which member had the most recent birthday.
Samples are weighted by gender, age, race, Hispanic ethnicity, education, region, adults in the household, cell phone-only status, cell phone-mostly status, and phone lines. Demographic weighting targets are based on the March 2009 Current Population Survey figures for the aged 18 and older non-institutionalized population living in U.S. telephone households. All reported margins of sampling error include the computed design effects for weighting and sample design.
In addition to sampling error, question wording and practical difficulties in conducting surveys can introduce error or bias into the findings of public opinion polls.
For more details on Gallup's polling methodology, visit www.gallup.com.
