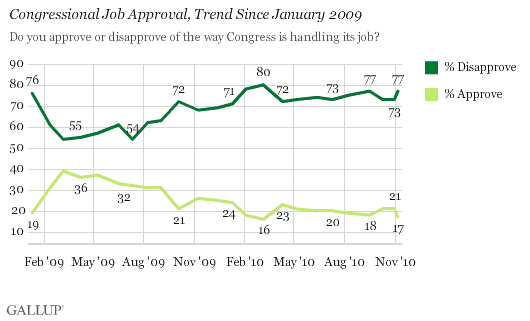
PRINCETON, NJ -- Congress' approval is at 17% in November, down slightly from 21% before the midterm elections. Historical patterns from 1994 and 2006 suggest that congressional approval will remain relatively stable at these low levels until January, when Republicans can be expected to become more positive as their party takes control of the House.

Americans' approval of Congress has remained relatively stable throughout 2010, ranging from a high of 24% in January to a low of 16% in March. The current 17% congressional approval rating, measured in Gallup's Nov. 4-7 post-election survey, reflects a slight drop from two readings in October, but is little changed from the 18% and 19% ratings measured in September and August, respectively. The all-time low for congressional approval was 14% in July 2008.
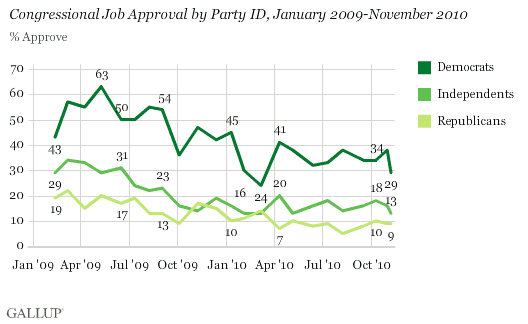
Democrats have consistently given Congress higher ratings than either Republicans or independents since President Obama and the then-newly elected Congress took office in February 2009. That pattern continues, although Democrats' approval of Congress has now dropped to its lowest point since March, most likely in response to the Republican gains in the midterm elections.

Currently, 29% of Democrats approve of the job Congress is doing, down from 38% in late October. Republicans' current 9% approval is unchanged from late October, while independents' rating, now at 13%, is down three percentage points.
Approval Often Shifts as New Congresses Take Office
Republicans won the House in the Nov. 2 elections, but history shows that the continuing low ratings of Congress among rank-and-file Republicans are likely to continue until the 112th Congress is seated in January.
When the Republicans took over the House from the Democrats in 1994, Republicans' approval of Congress remained low at 19% in December of that year, unchanged from October. But in January 1995, Republicans' approval shot up to 45% and then rose further to 58% in February. As a result, and given fairly stable approval ratings of Congress among independents and Democrats across this time period, overall congressional job approval rose from 23% in December 1994 to 33% and 38% in January and February 1995, respectively.

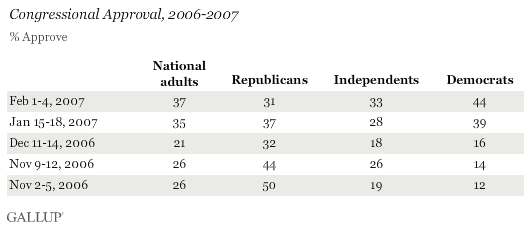
Democrats wrested control of Congress back from the Republicans in the 2006 midterm elections, but there was little shift in Democrats' approval of Congress from early November before the elections (12%) to mid-November, just after the elections (14%), and December (16%).
But in January 2007, Democrats' approval jumped to 39% and reached 44% by February of that year. In contrast to 1994, however, approval of Congress among those identifying with the party losing control of the House -- Republicans, in this instance -- began to slip immediately after the elections, dropping from 50% in early November to 32% by December. As a result, overall congressional approval dropped slightly, from 26% prior to the elections to 21% in December. Approval, however, jumped to 35% by January and 37% in February, fueled by the substantial increase in approval among Democrats.

In both 1994 and 2006, one party gained control of both houses of Congress; this year, the Republicans have won control of the House but the Democrats retain the Senate. Still, based on historical trends, it is probable that congressional approval will rise in January and in February, based on a projected increase in Republicans' approval as their party officially takes control of the House.
Results for this Gallup poll are based on telephone interviews conducted Nov. 4-7, 2010, with a random sample of 1,021 adults, aged 18 and older, living in the continental U.S., selected using random-digit-dial sampling.
For results based on the total sample of national adults, one can say with 95% confidence that the maximum margin of sampling error is ±4 percentage points.
Interviews are conducted with respondents on landline telephones (for respondents with a landline telephone) and cellular phones (for respondents who are cell phone-only). Each sample includes a minimum quota of 150 cell phone-only respondents and 850 landline respondents, with additional minimum quotas among landline respondents for gender within region. Landline respondents are chosen at random within each household on the basis of which member had the most recent birthday.
Samples are weighted by gender, age, race, education, region, and phone lines. Demographic weighting targets are based on the March 2009 Current Population Survey figures for the aged 18 and older non-institutionalized population living in continental U.S. telephone households. All reported margins of sampling error include the computed design effects for weighting and sample design.
In addition to sampling error, question wording and practical difficulties in conducting surveys can introduce error or bias into the findings of public opinion polls.
View methodology, full question results, and trend data.
For more details on Gallup's polling methodology, visit https://www.gallup.com/.
