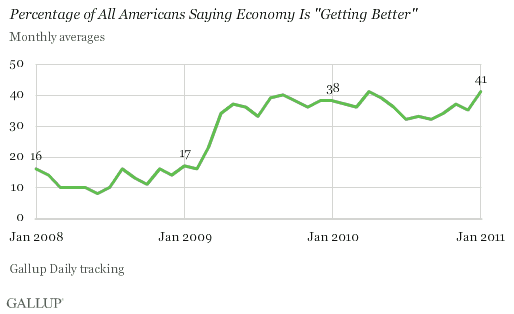
PRINCETON, NJ -- Forty-one percent of Americans in January said the economy is "getting better," up from 35% in December and 38% a year ago. This level of optimism ties for the highest since Gallup Daily tracking began in January 2008.

Year-Over-Year Changes in Expectations
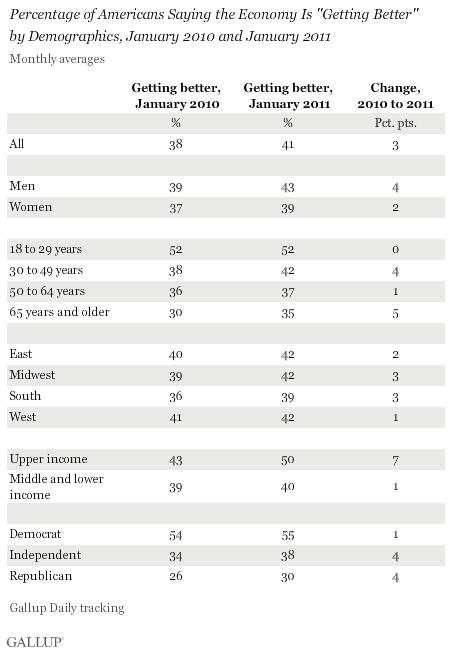
Half or more of upper-income Americans (those making at least $90,000 annually), younger Americans (those aged 18 to 29), and Democrats say economic conditions are getting better. This makes them the most optimistic among key demographic groups.
A comparison of January 2011 with January 2010 reveals that upper-income Americans (+7) and those aged 65 years and older (+5) have increased their optimism the most. Men show a larger increase than women in year-over-year expectations, while independents and Republicans show an increase and Democrats' optimism is essentially unchanged. Democrats and young Americans have held -- but not added to -- their high level of optimism.

Economic Confidence at Three-Year High
Americans' economic optimism is one of two measures that make up Gallup's Economic Confidence Index. The other -- consumers' perceptions of current economic conditions -- also improved in January, with 42% of Americans rating current economic conditions "poor," a slight improvement from 44% in December 2010 and 45% in January 2010. At -21, the combined Economic Confidence Index also indicates that Americans are more positive about the economy than they have been at any time during the past three years.

Differences in Optimism Reflect Economic Conditions
Consumer optimism about the future course of the economy is affected by what is happening on Wall Street, in the jobs market, and on Main Street. However, these factors tend to affect various groups of Americans differently.
Upper-income Americans are currently one of the most optimistic groups about the future course of the economy, and their optimism is up the most over the past year. This likely reflects that Wall Street has reached highs not seen since mid-2008 and the government has extended the Bush tax cuts. It is likely also a positive sign for the economy in 2011 because these consumers have the disposable income to spend if they feel comfortable doing so.
Younger Americans continue to be more optimistic than other age groups but their optimism has not increased from a year ago. It may be that their natural optimism and the modest improvement in job market conditions over the past year are sufficient for them to stay comparatively optimistic. However, the reality of anemic job growth more recently, particularly over the past five months, may be keeping them from becoming more optimistic.
Senior citizens and those 30 to 49 years of age are not as optimistic as their younger counterparts about the U.S. economy, but show a substantial increase in optimism. This upswing may be based partly on the improvements on Wall Street for the former group and perhaps on the modest improvements in the job market for the latter.
The comparatively high level of optimism among Democrats may have to do with their continued confidence in the Obama administration and the Democrats' ongoing control of the Senate after the midterm elections. However, the loss of the House and, perhaps more importantly, the continued weakness in jobs may be keeping them from becoming more optimistic than they were a year ago. Republicans and independents are more optimistic after the November election results -- and could feel that the economy and jobs situation are a little better than they were a year ago.
Whatever the reasons, it is a positive for the U.S. economic outlook that Americans are as optimistic as they have been at any time since in the past three years. A particular bright spot is the improved outlook among those with money to spend; still, the question is whether all of this optimism will translate into the increased consumer spending the economy so greatly needs.
Gallup.com reports results from these indexes in daily, weekly, and monthly averages and in Gallup.com stories. Complete trend data are always available to view and export in the following charts:
Daily: Employment, Economic Confidence and Job Creation, Consumer Spending
Weekly: Employment, Economic Confidence, Job Creation, Consumer Spending
Read more about Gallup's economic measures.
View our economic release schedule.
Survey Methods
Results are based on telephone interviews conducted with 8,755 respondents, aged 18 and older, living in all 50 U.S. states and the District of Columbia, during January 2011 as part of Gallup Daily tracking, selected using random-digit-dial sampling.
For results based on the total weekly sample of national adults, one can say with 95% confidence that the maximum margin of sampling error is ±2 percentage points. For results based on the total monthly sample of more than 15,000 national adults, one can say with 95% confidence that the maximum margin of sampling error is ±1 percentage point.
Interviews are conducted with respondents on landline telephones and cellular phones, with interviews conducted in Spanish for respondents who are primarily Spanish-speaking. Each daily sample includes a minimum quota of 200 cell phone respondents and 800 landline respondents, with additional minimum quotas among landline respondents for gender within region. Landline respondents are chosen at random within each household on the basis of which member had the most recent birthday.
Samples are weighted by gender, age, race, Hispanic ethnicity, education, region, adults in the household, cell phone-only status, cell phone-mostly status, and phone lines. Demographic weighting targets are based on the March 2010 Current Population Survey figures for the aged 18 and older non-institutionalized population living in U.S. telephone households. All reported margins of sampling error include the computed design effects for weighting and sample design.
In addition to sampling error, question wording and practical difficulties in conducting surveys can introduce error or bias into the findings of public opinion polls.
For more details on Gallup's polling methodology, visit www.gallup.com.
