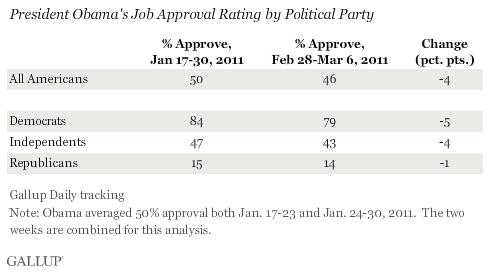
PRINCETON, NJ -- President Barack Obama averaged 46% job approval the week of Feb. 28-March 6, his lowest weekly average since mid-December. Obama's weekly approval rating had steadily improved from mid-December to late January, peaking at 50% during the final two weeks in January, before dropping below that mark in February.

Obama is now essentially back to where he was in the immediate post-election phase of 2010. The decline could be due to a number of issues the administration is dealing with, including the popular uprisings in the Middle East, the resulting higher gas prices, and disagreements with the Republicans in Congress about the best way to rein in federal spending.
The seven-week period from mid-December through the end of January was the longest stretch Obama has had of stable or improving ratings. Prior to that, there were several periods when his ratings either held steady or improved four weeks in a row, including a stretch from April to May 2009 that saw his approval ratings improve by a total of five percentage points.
Compared with the final two weeks of January, when Obama averaged 50% overall approval, his recent drop in support has come mainly from Democrats and independents. Last week, an average of 79% of Democrats approved of Obama, down from 84% in late January. The president's 43% approval rating among independents is down from 47% in late January, while his approval rating among Republicans is essentially the same (15% in late January and 14% now).

The 79% approval rating for Obama among Democrats is his first below 80% in any week since mid-December.
Implications
The end of 2010 and beginning of 2011 brought about a rebound in support for President Obama, to the extent that his average weekly approval ratings returned to the 50% level for the first time since May. That period of improved support appears to be over, now that his ratings have returned to the mid-40% range.
The continued rise in gas prices could pose a real threat to Obama's public support. Gallup has noted that high gas prices typically bring down a president's approval rating, and indeed some of the lowest approval ratings in Gallup history have come during times of high gas prices.
Obama's re-election prospects will probably hinge to a great deal on whether the public perceives the economy to be improving. If high gas prices or other factors stall that recovery, and his approval rating remains below 50%, a second Obama term could be in jeopardy.
Explore President Obama's approval ratings in depth and compare them with those of past presidents in the Gallup Presidential Job Approval Center.
Survey Methods
Results are based on telephone interviews conducted as part of Gallup Daily tracking Feb. 28-March 6, 2011, with a random sample of 3,521 adults, aged 18 and older, living in all 50 U.S. states and the District of Columbia, selected using random-digit-dial sampling.
For results based on the total sample of national adults, one can say with 95% confidence that the maximum margin of sampling error is ±2 percentage points.
The questions reported here are asked of a random half-sample of respondents each day on the Gallup Daily tracking survey.
Interviews are conducted with respondents on landline telephones and cellular phones, with interviews conducted in Spanish for respondents who are primarily Spanish-speaking. Each daily sample includes a minimum quota of 200 cell phone respondents and 800 landline respondents, with additional minimum quotas among landline respondents for gender within region. Landline respondents are chosen at random within each household on the basis of which member had the most recent birthday.
Samples are weighted by gender, age, race, Hispanic ethnicity, education, region, adults in the household, cell phone-only status, cell phone-mostly status, and phone lines. Demographic weighting targets are based on the March 2010 Current Population Survey figures for the aged 18 and older non-institutionalized population living in U.S. telephone households. All reported margins of sampling error include the computed design effects for weighting and sample design.
In addition to sampling error, question wording and practical difficulties in conducting surveys can introduce error or bias into the findings of public opinion polls.
For more details on Gallup's polling methodology, visit www.gallup.com.
