WASHINGTON, D.C. -- Residents of Hawaii, Alaska, and Wyoming are the most likely among residents of U.S. states to be "thriving," based on how they rate their lives at this time and five years from now, while residents of West Virginia and Kentucky are the least likely.
These state-level findings are based on Gallup Daily tracking surveys conducted for the Gallup-Healthways Well-Being Index from January through December 2010. Gallup classifies Americans as "thriving," "struggling," or "suffering" according to how they rate their lives "at this time" and "about five years from now" on a ladder scale based on the Cantril Self-Anchoring Striving Scale. Those who are thriving rate their current life a 7 or better and their life in five years an 8 or better.
The same questions are used to calculate scores for the Life Evaluation Index, which is one of six subcomponents in the overall Gallup-Healthways Well-Being Index. While Hawaii does best and West Virginia worst on both metrics, 19.7 percentage points separate them on this metric, compared with 9.3 percentage points on the Well-Being Index.
Hawaii Leads Nation in Current and Future Life Ratings
Residents of Hawaii lead the nation on the thriving measure by a significant margin because they rate their lives at this time and their lives in five years significantly better than do residents of other states. Residents of Alaska, Maryland, and Texas also are among the most positive in the nation on both measures.
Residents of North Dakota and Wyoming -- both among the leaders in the nation on the thriving measure -- are second only to residents of Hawaii on how they rate their lives at the current time, at 7.2 on average. Residents of Georgia, Louisiana, Mississippi, and Utah shine in terms of their optimistic attitudes about their lives five years from now, rating their future lives a 7.9 or higher on average.
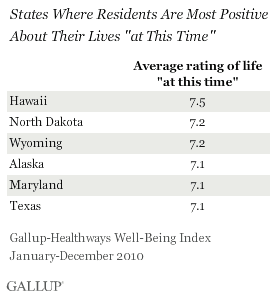
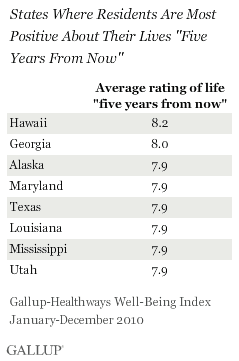
Americans' ratings of their lives five years from now consistently exceed ratings of their current lives, both over time and across all 50 states. This suggests that people in various situations -- good and bad -- tend to express optimism that things will improve in the future.
No Clear Regional Differences in Life Ratings
There is no clear regional pattern to the states that do better or worse in terms of percentage of residents who are thriving. Further, there is much more variation among neighboring states than seen in Well-Being Index state scores.
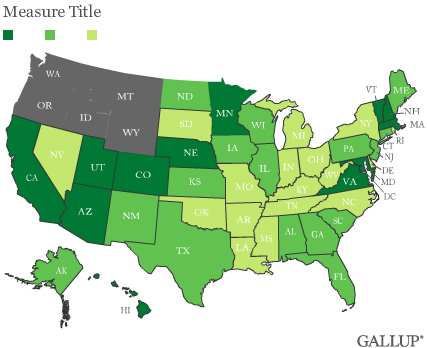
As a point of comparison, the percentage of residents thriving in Hawaii -- the nation's highest -- is on par with many of the top performing countries worldwide based on Gallup's global findings on this measure from 2009, trailing a handful of countries in Western Europe. The worst performing U.S. state, West Virginia, still outperforms many countries in the developed world, including those hard hit economically in the past few years such as Spain, France, and Greece.
Implications
The challenges and opportunities facing U.S. states are as unique as their geography and their people. That said, certain states are buoyed up by their residents' positivity about their lives today and optimism about their lives going forward.
A review of other Gallup Daily tracking measures at the state level does not reveal a clear-cut pattern as to why residents in some states rate their lives better than others. While economic circumstances are undoubtedly one factor, other factors play a role as well. North Dakota and Wyoming, both high performers on the thriving measure, have the two lowest underemployment rates in the country. At the same time, Hawaii has one of the higher rates.
Hawaii, Maryland, North Dakota, and Texas are among the states with the highest economic confidence, while Georgia and Louisiana are average and Wyoming is below average.
The optimism seen in Texas, Louisiana, and Georgia may stem from the relatively high percentage of workers who tell Gallup their employer is "hiring." However, similar numbers of residents in the low thriving states of West Virginia and Arkansas say the same.
While seven of the states with the highest percentage of residents thriving also are among the states with the highest overall well-being, Maryland, Georgia, Texas, New Mexico, and Louisiana are among the best performers on this more subjective measure.
It is clear that residents take into account many objective and subjective factors when rating their lives now and going forward. This illustrates why it is important to go beyond classic economic metrics when assessing a community's well-being. States that are able to rise above difficult economic circumstances to instill a sense of positivity and optimism among their residents set a powerful example for other states to follow.
See the complete data for all states on page 2.
Gallup's "State of the States" series reveals state-by-state differences on political, economic, and well-being measures Gallup tracks each day.
About the Gallup-Healthways Well-Being Index
The Gallup-Healthways Well-Being Index tracks U.S. well-being and provides best-in-class solutions for a healthier world. To learn more, please visit well-beingindex.com.
Survey Methods
Results are based on telephone interviews conducted as part of the Gallup-Healthways Well-Being Index survey Jan. 1-Dec. 29, 2010, with a random sample of 352,840 adults, aged 18 and older, living in all 50 U.S. states and the District of Columbia, selected using random-digit-dial sampling.
For results based on the total sample of national adults, one can say with 95% confidence that the maximum margin of sampling error is ±1 percentage point.
The margin of sampling error for most states is ±1 to ±2 percentage points, but is as high as ±4 points for smaller states such as Wyoming, North Dakota, South Dakota, Delaware, and Hawaii.
The Gallup-Healthways Well-Being Index categorizes the District of Columbia as a congressional district.
Interviews are conducted with respondents on landline telephones and cellular phones, with interviews conducted in Spanish for respondents who are primarily Spanish-speaking. Each daily sample includes a minimum quota of 200 cell phone respondents and 800 landline respondents, with additional minimum quotas among landline respondents for gender within region. Landline respondents are chosen at random within each household on the basis of which member had the most recent birthday.
Samples are weighted by gender, age, race, Hispanic ethnicity, education, region, adults in the household, cell phone-only status, cell phone-mostly status, and phone lines. Demographic weighting targets are based on the March 2010 Current Population Survey figures for the aged 18 and older non-institutionalized population living in U.S. telephone households. All reported margins of sampling error include the computed design effects for weighting and sample design.
In addition to sampling error, question wording and practical difficulties in conducting surveys can introduce error or bias into the findings of public opinion polls.
For more details on Gallup's polling methodology, visit https://www.gallup.com/.
