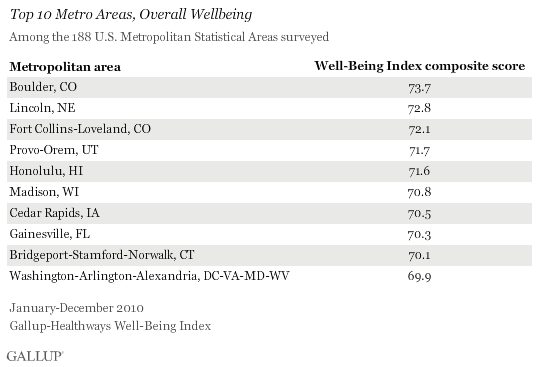
WASHINGTON, D.C. -- Boulder, Colo., had the highest Well-Being Index score in the U.S. across the 188 metropolitan areas that Gallup and Healthways surveyed in 2010. Lincoln, Neb.; Fort Collins-Loveland, Colo.; Provo-Orem, Utah; and Honolulu round out the top five metro areas with the highest well-being.

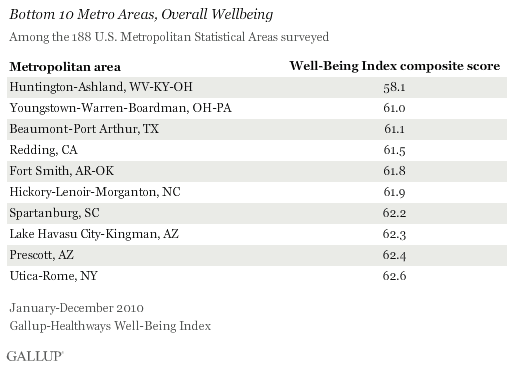
Huntington-Ashland, W.Va.-Ky.,-Ohio, had the lowest Well-Being Index score in 2010, at 58.1, and the only score below 60 in the nation. The regional breakdown in well-being scores is largely consistent with Gallup and Healthways state-level results, which find well-being higher in the West and lower in the South.

The "cities" this article references are based on the Metropolitan Statistical Areas (MSAs) as defined by the U.S. Office of Management and Budget. In many cases, more than one city is included in the same MSA.
The Gallup-Healthways Well-Being Index score is an average of six sub-indexes, which individually examine life evaluation, emotional health, work environment, physical health, healthy behaviors, and access to basic necessities. The overall score and each of the six sub-index scores are calculated on a scale from 0 to 100, where a score of 100 represents the ideal. Gallup and Healthways have been tracking these measures daily since January 2008.
Honolulu Tops List in Life Evaluation and Emotional Health
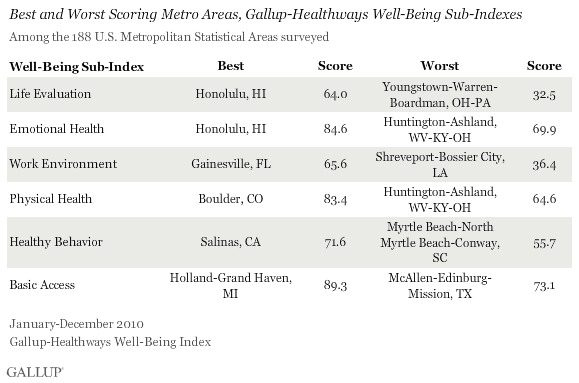
Honolulu had the highest scores on two of the six sub-indexes: Life Evaluation and Emotional Health. Boulder had the highest score in the nation on the Physical Health Index, while Holland-Grand Haven, Mich., residents had the best access to basic necessities. Gainesville, Fla., had the highest Work Environment Index score, and residents living in Salinas, Calif., had the highest Healthy Behaviors Index score.

The metro area that reports the worst life evaluation has a score that is about half of what the highest scoring city reports. Similarly, the metro area where employed residents report the worst work environments has a score that is half of what the highest scoring city scored for the same sub-index.
Huntington-Ashland residents reported the worst emotional and physical health, while healthy behaviors were least prevalent in the Myrtle Beach, S.C., metro area in 2010. McAllen-Edinburg-Mission, Texas, residents reported the worst access to basic necessities, which is tied in part to the high percentage of uninsured in the metro area.
Washington, D.C., and Austin, Texas, Have Highest Well-Being Among Large Cities
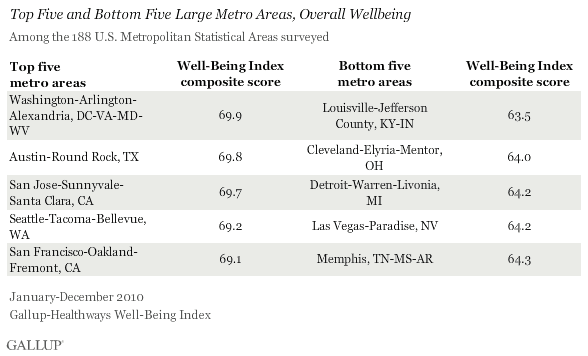
Washington, D.C.-Arlington-Alexandria, Va.-Md.-W.Va., residents had the highest well-being among the nation's 52 largest metropolitan areas, those with 1 million or more residents, followed closely by Austin-Round Rock, Texas.
Louisville-Jefferson County, Ky.-Ind., had the lowest well-being among large cities.

Implications
Community leaders stand to learn a great deal from cities like Boulder, Lincoln, and Washington, D.C. where well-being is the highest.
Boulder, for example, is second in the nation in opportunities for its residents to "learn something new or interesting," a common feature of the highest well-being metro areas in America. Book stores, museums, art exhibits, and non-traditional learning environments, such as topical community seminars at local colleges or Elderhostel programs, could all contribute to enhanced opportunities for residents to learn and grow, which can lead to higher well-being.
Lincoln is third in the nation in having workplaces with supervisors who engender high-trust environments, a characteristic of top management talent and a vanguard of a highly engaged and productive workforce.
The Washington, D.C.-Arlington-Alexandria metro area has one of the lowest smoking rates among large metro areas in America, at 15%, and a high percentage of residents who visit a dentist at least once per year (72%). Smoking and choosing to skip the dentist are both lifestyle choices that have substantial negative health outcomes downstream.
The high-level results discussed in this article provide a sampling of what the Gallup-Healthways Well-Being Index metrics reveal about U.S. cities. Even the metro areas with the highest overall well-being have specific areas in need of improvement, and those with the lowest overall well-being have strengths that leaders can celebrate or develop to inspire improvement in other areas. By understanding these strengths and weaknesses, leaders can make better strategic and tactical decisions to affect positive change in their communities, improving individual lives and the nation overall.
About the Gallup-Healthways Well-Being Index
The Gallup-Healthways Well-Being Index tracks U.S. well-being and provides best-in-class solutions for a healthier world. To learn more, please visit well-beingindex.com.
Survey Methods
Results are based on telephone interviews conducted as part of the Gallup-Healthways Well-Being Index survey Jan. 2-Dec. 29, 2011, with a random sample of 245,817 adults, aged 18 and older, living in reportable metropolitan statistical areas in all 50 U.S. states and the District of Columbia, selected using random-digit-dial sampling.
Metro areas in this article are based on the Metropolitan Statistical Areas (MSAs) as defined by the U.S. Office of Management and Budget. In many cases, more than one city is included in the same MSA. The San Jose, Calif., MSA, for example, also includes the smaller nearby cities of Sunnyvale and Santa Clara in addition to San Jose itself. Each respondent is attributed to his or her MSA based on the self-report of his or her ZIP code. Gallup reports data for MSAs for which there were at least 300 completed interviews in 2010. A total of 188 MSAs met this criterion, which generally incorporates the larger MSAs according to population size.
Maximum expected error ranges for the MSAs vary according to size, ranging from less than 1 percentage point for the largest cities represented to ±6.5 percentage points for the smallest. Interviews are conducted with respondents on landline telephones (for respondents with a landline telephone) and cellular phones (for respondents who are cell phone only and cell phone mostly.)
In addition to sampling error, question wording and practical difficulties in conducting surveys can introduce error or bias into the findings of public opinion polls.
For more details on Gallup's polling methodology, visit https://www.gallup.com/.
