WASHINGTON, D.C. -- Colorado, Hawaii, and Utah had the lowest obesity levels in the United States in 2010, although at least 2 in 10 adults were obese in each of these states. West Virginia, Mississippi, and Kentucky had the highest obesity rates, with more than 3 in 10 obese residents living in these states. The prevalence of obesity is nearly eight percentage points higher, on average, in the 11 states with the highest obesity levels compared with the 10 states with the lowest obesity levels -- 30.5% vs. 22.6%, respectively.
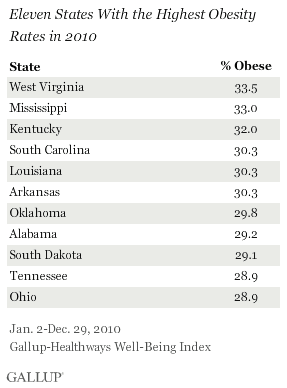 Nationally, 26.6% of American adults were obese in 2010, on par with 26.5% in 2009, but still up from 25.5% in 2008. These data, collected as part of the Gallup-Healthways Well-Being Index, are based on respondents' self-reports of their height and weight, which are used to calculate Body Mass Index (BMI) scores. Americans who have a BMI of 30 or higher are classified as "obese."
 |
| Explore complete state data > |
High Obesity Tied to Higher Rates of Diabetes Nationwide
The diabetes rate in the United States -- which is related to obesity -- also remains up from 2008, with 11.3% of American adults reporting in 2010 that they have ever been diagnosed with the disease, similar to 11.0% in 2009, but up from 10.6% in 2008.
The Gallup-Healthways Well-Being Index data highlight the relationship between obesity levels and diabetes diagnoses, revealing that there is an average diabetes rate of 9.9% in the 10 states with the lowest obesity levels, which is much lower than the average rate of 13.7% in the 11 states with the highest obesity levels.
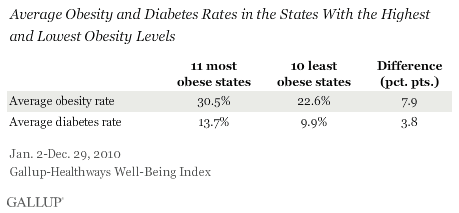
Accordingly, diabetes rates are highest in the same states where obesity levels are the highest: West Virginia, Kentucky, Alabama, Mississippi, and Tennessee. Americans are least likely to report ever having been diagnosed with diabetes in Alaska, Colorado, Montana, and North Dakota.
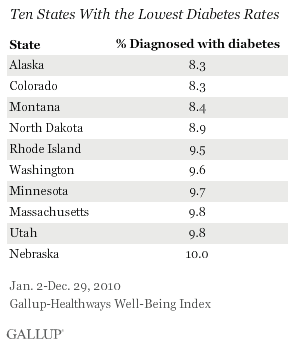
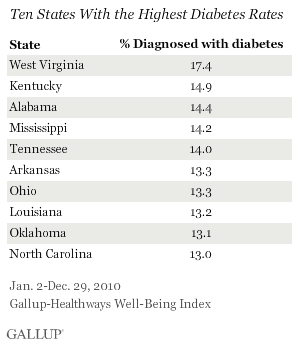 These data reveal that if the 11 states with the highest obesity levels had the same average obesity rate as the 10 states with the lowest obesity levels, approximately 3.3 million fewer American adults would be obese and there could be as many as 1.6 million fewer diagnosed with diabetes in those 10 states alone. If the remaining 40 states had the same average diabetes rate as the 10 states with the lowest obesity levels, approximately 4.6 million fewer American adults would have diabetes.
Obesity Rates High Throughout the South
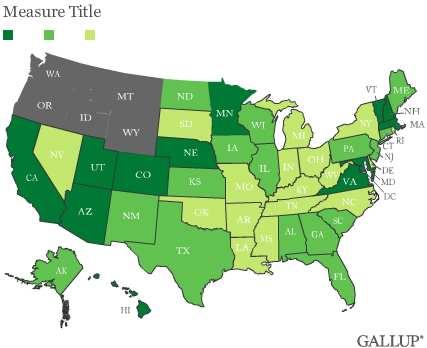
Regionally, obesity levels are the lowest in the West and the Northeast. Southern states, on the other hand, suffer from the highest obesity levels, as they did in 2009.
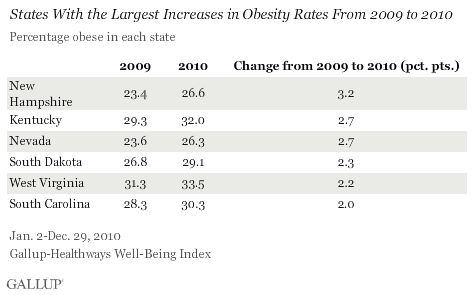
Obesity Levels Up Two Points or More in Six States in 2010
Obesity rates increased the most from 2009 levels in New Hampshire, Kentucky, Nevada, and South Dakota in 2010. Only in Wyoming did the percentage of those who are obese decline by more than two points in 2010.
Bottom Line
The implications of increasing obesity rates and the associated health outcomes of being obese are extensive for national, state, and local leaders. A recent Gallup study analyzed obesity data from 187 U.S. metro areas and found that if all of them reduced their obesity rates to the Centers for Disease Control and Prevention's national goal of 15%, the U.S. could save $32.6 billion in healthcare costs annually.
The 2010 state-level findings underscore the connection between high obesity levels and diabetes diagnosis and highlight how widespread this problem is across the country. Obesity and diabetes rates in the U.S. have only worsened since Gallup and Healthways started tracking these conditions daily in January 2008. Strong leadership at the governmental, organizational, and individual level focused on changing health habits, including encouraging more frequent exercise and healthy eating, is needed to begin to reduce these costly and potentially deadly health issues.
Gallup's "State of the States" series reveal state-by-state differences on political, economic, and well-being measures Gallup tracks each day.
About the Gallup-Healthways Well-Being Index
The Gallup-Healthways Well-Being Index tracks U.S. well-being and provides best-in-class solutions for a healthier world. To learn more, please visit well-beingindex.com.
Survey Methods
Results are based on telephone interviews conducted as part of the Gallup-Healthways Well-Being Index survey Jan. 2-Dec. 29, 2010, with a random sample of 352,840 adults, aged 18 and older, living in all 50 U.S. states and the District of Columbia, selected using random-digit-dial sampling.
For results based on the total sample of national adults, one can say with 95% confidence that the maximum margin of sampling error is ±1 percentage point.
The margin of sampling error for most states is ±1 to ±2 percentage points, but is as high as ±4 points for states with smaller population sizes such as Wyoming, North Dakota, South Dakota, Delaware, and Hawaii.
Interviews are conducted with respondents on landline telephones and cellular phones, with interviews conducted in Spanish for respondents who are primarily Spanish-speaking. Each daily sample includes a minimum quota of 200 cell phone respondents and 800 landline respondents, with additional minimum quotas among landline respondents for gender within region. Landline respondents are chosen at random within each household on the basis of which member had the most recent birthday.
Samples are weighted by gender, age, race, Hispanic ethnicity, education, region, adults in the household, cell phone-only status, cell phone-mostly status, and phone lines. Demographic weighting targets are based on the March 2010 Current Population Survey figures for the aged 18 and older non-institutionalized population living in U.S. telephone households. All reported margins of sampling error include the computed design effects for weighting and sample design.
In addition to sampling error, question wording and practical difficulties in conducting surveys can introduce error or bias into the findings of public opinion polls.
For more details on Gallup's polling methodology, visit https://www.gallup.com/.
