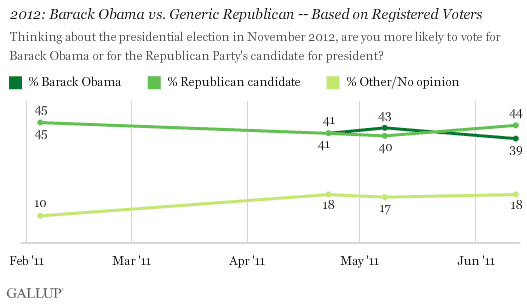
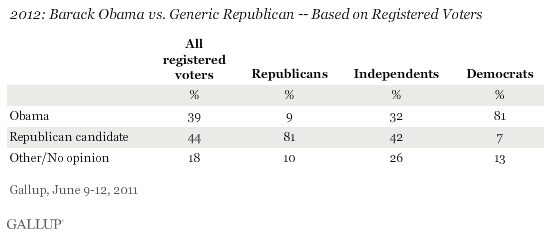
PRINCETON, NJ -- Forty-four percent of registered voters say they are more likely to vote for "the Republican Party's candidate" and 39% for Barack Obama in the 2012 presidential election, according to Gallup's June update. The current five-percentage-point edge for the generic Republican is not a statistically significant lead, and neither side has held a meaningful lead at any point thus far in 2011.

These results are based on a June 9-12 Gallup poll. The competitiveness of the race is underscored by the fact that Obama's re-election prospects on this measure did not appear much better in May, when his approval rating rose to the 50% level. Now that the rally in support for Obama is essentially over, the president appears to be in a slightly weaker position but still very competitive with his as-yet-unnamed opponent.
Voters' uncertainty about what they might do in the 2012 election is also apparent in the 18% who do not have a preference for Obama or the Republican at this point.
The poll finds Republican and Democratic registered voters supporting their party's candidate at similar levels, with independents breaking more for the Republican than for Obama. A substantial 26% of independent voters do not have a preference.

In Gallup's April and May updates on 2012 presidential election preferences, independent voters were evenly divided between Obama and the Republican candidate.
June Results Bear Little Relation to Election Outcome
Gallup asked similar generic ballot questions leading up to the 1992 and 2004 elections, when an incumbent president (George H.W. Bush and George W. Bush, respectively) was seeking re-election but his likely opponent was unknown, given that there was not an obvious front-runner in the Democratic primaries in those years.
In June 1991 and June 2003, both Bushes held wide leads over their generic Democratic opponents. At those times, both presidents were quite popular, with the elder Bush averaging 72% approval in June 1991 and the younger Bush 62% approval in June 2003. Obama averaged 46% approval during the most recent week of Gallup Daily tracking.
Neither June generic ballot result was highly predictive of the eventual outcome; the elder Bush was defeated for re-election and the younger Bush won a narrow victory.

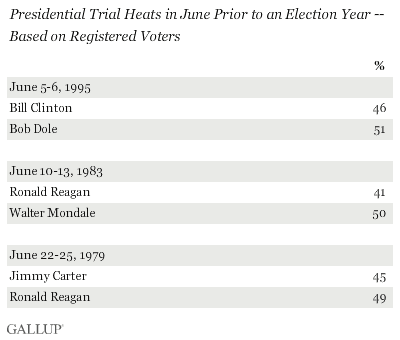
In other presidential election cycles when an incumbent sought re-election, there were obvious front-runners for the other party's nomination, so Gallup typically pitted the incumbent against that opponent in trial heat questions. These results from June in the year prior to the presidential election were also not highly predictive of the outcomes. Ronald Reagan trailed Walter Mondale in 1983 and Bill Clinton faced a five-point deficit to Bob Dole in 1995, but each incumbent handily won the election the following year. In 1979, Reagan held a slim advantage over Jimmy Carter, with Reagan denying Carter a second term in the 1980 election.

At the time those polls were conducted, Reagan (45%) and Clinton (47%) had approval ratings similar to Obama's current 46%. Carter's was significantly lower, at 29%, because of the summer 1979 energy crisis.
Implications
Presidential preferences long before an election can give an indication of the current political environment, but their relationship to the eventual election outcome shows how much that environment can change in the months leading up to the election. If the election were held today, Obama would appear to be in a tough fight for re-election with a fairly close division in registered-voter preferences between the president and a generic Republican.
Regardless of whom Republicans nominate, if national conditions improve, as was the case from 1983 to 1984 and 1995 to 1996, Obama could win re-election easily. If they do not, as occurred between 1979 and 1980, or get worse, as happened from 1991 to 1992, he could be vulnerable to defeat by whomever the Republicans nominate.
Survey Methods
Results for this Gallup poll are based on telephone interviews conducted June 9-12, 2011, with a random sample of 914 registered voters, aged 18 and older, living in all 50 U.S. states and the District of Columbia.
For results based on the total sample of registered voters, one can say with 95% confidence that the maximum margin of sampling error is ±4 percentage points.
Interviews are conducted with respondents on landline telephones and cellular phones, with interviews conducted in Spanish for respondents who are primarily Spanish-speaking. Each sample includes a minimum quota of 400 cell phone respondents and 600 landline respondents per 1,000 national adults, with additional minimum quotas among landline respondents for gender within region. Landline telephone numbers are chosen at random among listed telephone numbers. Cell phone numbers are selected using random-digit-dial methods. Landline respondents are chosen at random within each household on the basis of which member had the most recent birthday.
Samples are weighted by gender, age, race, Hispanic ethnicity, education, region, adults in the household, and phone status (cell phone only/landline only/both, cell phone mostly, and having an unlisted landline number). Demographic weighting targets are based on the March 2010 Current Population Survey figures for the aged 18 and older non-institutionalized population living in U.S. telephone households. All reported margins of sampling error include the computed design effects for weighting and sample design.
In addition to sampling error, question wording and practical difficulties in conducting surveys can introduce error or bias into the findings of public opinion polls.
View methodology, full question results, and trend data.
For more details on Gallup's polling methodology, visit www.gallup.com.
