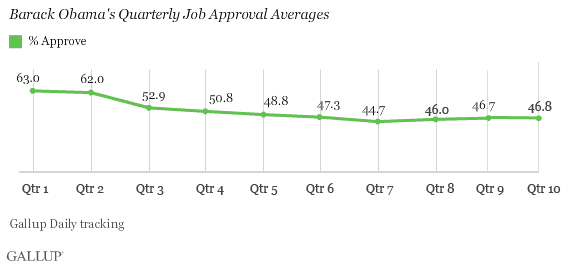
PRINCETON, NJ -- President Barack Obama earned a 46.8% average approval rating in his 10th quarter in office ending July 19, essentially unchanged from the 9th quarter and still above his record-low 7th quarter.

The president's latest quarterly average is based on Gallup Daily tracking from April 20 through July 19. Across that time, his three-day rolling average approval ratings have been as high as 53% and as low as 42%, with the most recent readings falling on the lower end of that range.
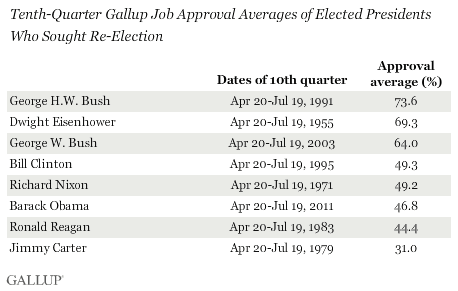
Obama is in the company of several former elected presidents who averaged sub-50% approval during their 10th quarters in office. This includes three former presidents who won re-election -- Bill Clinton, Richard Nixon, and Ronald Reagan -- and one, Jimmy Carter, who lost. On the other hand, of the three presidents with exceptionally high average approvals at this stage, George H.W. Bush was ultimately defeated, while Dwight Eisenhower and George W. Bush prevailed.

This is the sixth straight quarter Obama has received less than majority approval. As a result, his average job approval rating has been below 50% for more of his presidency than it has not. However, both Clinton and Reagan experienced seven months of sub-50% average approval ratings in the middle of their first terms, indicating this is not a disqualifier for re-election.
Additionally, the lowest quarterly average ratings for Clinton (41.4%) and Reagan (38.8%) during these periods were lower than Obama's lowest quarterly average to date (44.7%).
Job Approval Foreshadows Re-election by 12th and 13th Quarters
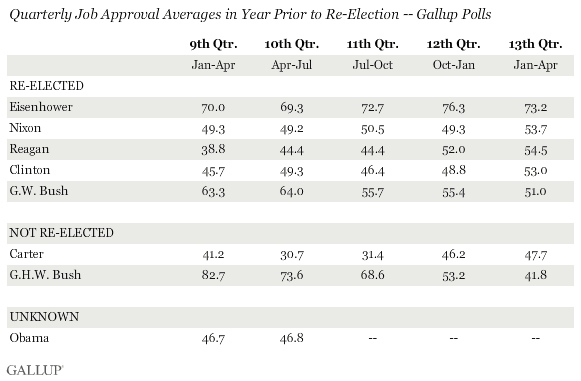
Unlike Obama, both Reagan and Clinton saw some improvement in their average approval ratings between the 9th and 10th quarters. However that momentum was not continued in the next few quarters, so the importance of the 10th quarter shift is unclear.
After persisting below 50% through most of 1983, Reagan's average quarterly approval rating jumped above 50% in his 12th quarter (spanning surveys conducted between Oct. 20, 1983, and Jan. 19, 1984). Clinton and Nixon made this leap in their 13th quarters, less than a year prior to being re-elected.
Conversely, George H.W. Bush experienced a steep decline in his approval ratings during 1991 -- the year before he was defeated -- and by his 13th quarter -- the beginning of 1992 -- he dropped well below 50%, never to recover. Jimmy Carter saw his dismal 1979 average approval ratings improve in 1980, his re-election year, but never beyond 48%.

Bottom Line
President Obama's job approval rating averaged just under 47% in the latest quarter, continuing a pattern of sub-50% approval ratings for him that started early in 2010. While this is not an auspicious indicator for a president's re-election in the final months leading up to election, it is still too early to say what it forebodes for 2012. There is not a consistent enough pattern in the quarterly approval averages of prior presidents to say whether a 46.8% average approval in the 10th quarter points toward re-election or defeat. History suggests Obama's 12th and 13th quarter ratings are likely to be much more valuable in this respect.
Survey Methods
Results are based on telephone interviews conducted as part of Gallup Daily tracking April 20 -July 19, 2011, with a random sample of 45,110 adults, aged 18 and older, living in all 50 U.S. states and the District of Columbia.
For results based on the total sample of national adults, one can say with 95% confidence that the maximum margin of sampling error is ±1 percentage point.
Interviews are conducted with respondents on landline telephones and cellular phones, with interviews conducted in Spanish for respondents who are primarily Spanish-speaking. Each sample includes a minimum quota of 400 cell phone respondents and 600 landline respondents per 1,000 national adults, with additional minimum quotas among landline respondents for gender within region. Landline telephone numbers are chosen at random among listed telephone numbers. Cell phones numbers are selected using random digit dial methods. Landline respondents are chosen at random within each household on the basis of which member had the most recent birthday.
Samples are weighted by gender, age, race, Hispanic ethnicity, education, region, adults in the household, and phone status (cell phone-only/landline only/both, cell phone mostly, and having an unlisted landline number). Demographic weighting targets are based on the March 2010 Current Population Survey figures for the aged 18 and older non-institutionalized population living in U.S. telephone households. All reported margins of sampling error include the computed design effects for weighting and sample design.
In addition to sampling error, question wording and practical difficulties in conducting surveys can introduce error or bias into the findings of public opinion polls.
For more details on Gallup's polling methodology, visit www.gallup.com.
