PRINCETON, NJ -- Seventy-three percent of Americans in Gallup Daily tracking over the July 22-24 weekend say the U.S. economy is getting worse. This is up 11 percentage points from the three days ending July 6, and the worst level for this measure since the three days ending March 12, 2009.

Gallup tracks consumer perceptions of the U.S. economy daily and reports the results in three-day rolling, weekly, and monthly averages. More Americans have been saying the U.S. economy is getting worse throughout June and early July than said this over most of the previous five months. However, the number of Americans feeling this way has risen further over the last few weeks.
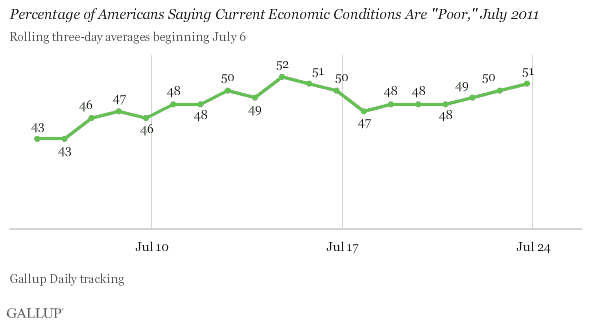
Half Rate the Current Economy "Poor"
Fifty-one percent of Americans rated current economic conditions "poor" over the weekend. This is up from 43% in early July, reflecting a continued deterioration in many Americans' views.

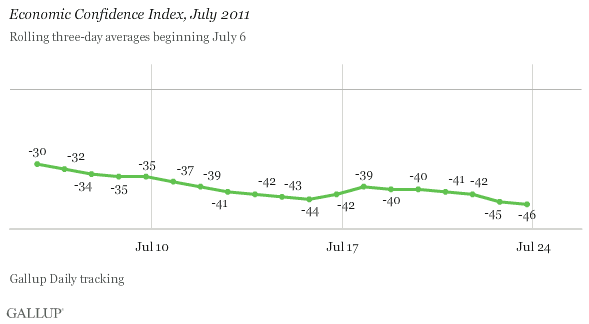
Economic Confidence at Recessionary Levels
As a result of the declines in Americans' assessments of the economy's current state and its future direction, Gallup's Economic Confidence Index fell sharply to -46 in the three days ending July 24 -- worsening from -41 before the weekend and -30 at the beginning of the month.

On a weekly basis, the Economic Confidence Index fell to -43 for the week ending July 24. This is its lowest weekly level since the week ending March 22, 2009.
Implications
The president, the Treasury secretary, and congressional leaders worried openly over the weekend about what might happen in the international financial markets if a debt-ceiling increase agreement wasn't reached. They feared trouble in the Asian money markets when they opened on Sunday night and on Wall Street on Monday morning. Although there were some losses in the money markets after a debt ceiling deal failed to materialize, these were far less than might have been expected -- particularly in light of what government leaders were saying.
Still, Gallup's data show that Americans' perceptions of the future of the U.S. economy should be the real concern for policymakers and the overall economy. All of the talk about default likely has weighed on consumer confidence, as has the dismal jobs market, increasing gas prices, and the economic soft patch.
It may be that once the debt ceiling battle is resolved, economic confidence will return. In the interim, however, it appears consumer psychology is continuing to deteriorate rapidly. The Conference Board is likely to pick up on this when it reports its Consumer Confidence Index later this week. It is also likely to be reflected in an anemic back-to-school sales season in the weeks ahead.
Gallup.com reports results from these indexes in daily, weekly, and monthly averages and in Gallup.com stories. Complete trend data are always available to view and export in the following charts:
Daily: Employment, Economic Confidence and Job Creation, Consumer Spending
Weekly: Employment, Economic Confidence, Job Creation, Consumer Spending
Read more about Gallup's economic measures.
View our economic release schedule.
Survey Methods
Results are based on telephone interviews conducted on a three-day rolling basis in July 2011, ending July 24. For the three days ending July 24, 2011, on the Gallup Daily tracking survey, interviews were conducted with a random sample of 1,529 adults, aged 18 and older, living in all 50 U.S. states and the District of Columbia.
For results based on the total sample of national adults, one can say with 95% confidence that the maximum margin of sampling error is ±4 percentage points.
Interviews are conducted with respondents on landline telephones and cellular phones, with interviews conducted in Spanish for respondents who are primarily Spanish-speaking. Each sample includes a minimum quota of 400 cell phone respondents and 600 landline respondents per 1,000 national adults, with additional minimum quotas among landline respondents for gender within region. Landline telephone numbers are chosen at random among listed telephone numbers. Cell phone numbers are selected using random-digit-dial methods. Landline respondents are chosen at random within each household on the basis of which member had the most recent birthday.
Samples are weighted by gender, age, race, Hispanic ethnicity, education, region, adults in the household, and phone status (cell phone only/landline only/both, cell phone mostly, and having an unlisted landline number). Demographic weighting targets are based on the March 2010 Current Population Survey figures for the aged 18 and older non-institutionalized population living in U.S. telephone households. All reported margins of sampling error include the computed design effects for weighting and sample design.
In addition to sampling error, question wording and practical difficulties in conducting surveys can introduce error or bias into the findings of public opinion polls.
For more details on Gallup's polling methodology, visit www.gallup.com.
