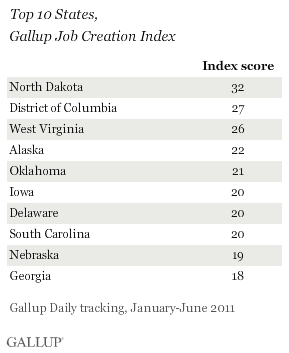
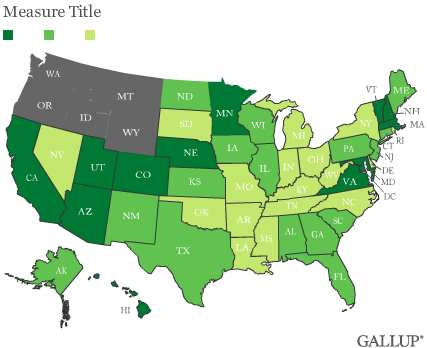
PRINCETON, NJ -- Gallup's Job Creation Index shows that Washington, D.C., as well as energy- and commodity-producing states continue to dominate the 10 best job markets during the first half of 2011, as they did over the same period in 2010.


These results are based on aggregated data from nearly 100,000 interviews with employed adults during the first half of 2011, conducted as part of Gallup Daily tracking. Gallup asks those who are employed whether their companies are hiring workers and expanding the size of their labor forces, not changing the size of their workforces, or laying off workers and reducing their workforces. The figures reported here represent the net difference between the percentage reporting an expansion and the percentage reporting a reduction in their workforces.
The energy-producing states of North Dakota, Oklahoma, and West Virginia have been in the 10 "best state job markets" for the past 3 ½ years, from 2008 to mid-2011. They are joined by the District of Columbia -- a federal government-based job market -- and Iowa, a farm commodity and energy state, both of which were also in the top 10 in 2010. New to the top 10 job market states during the first half of 2011 are Delaware and the three farm commodity states of South Carolina, Nebraska, and Georgia.
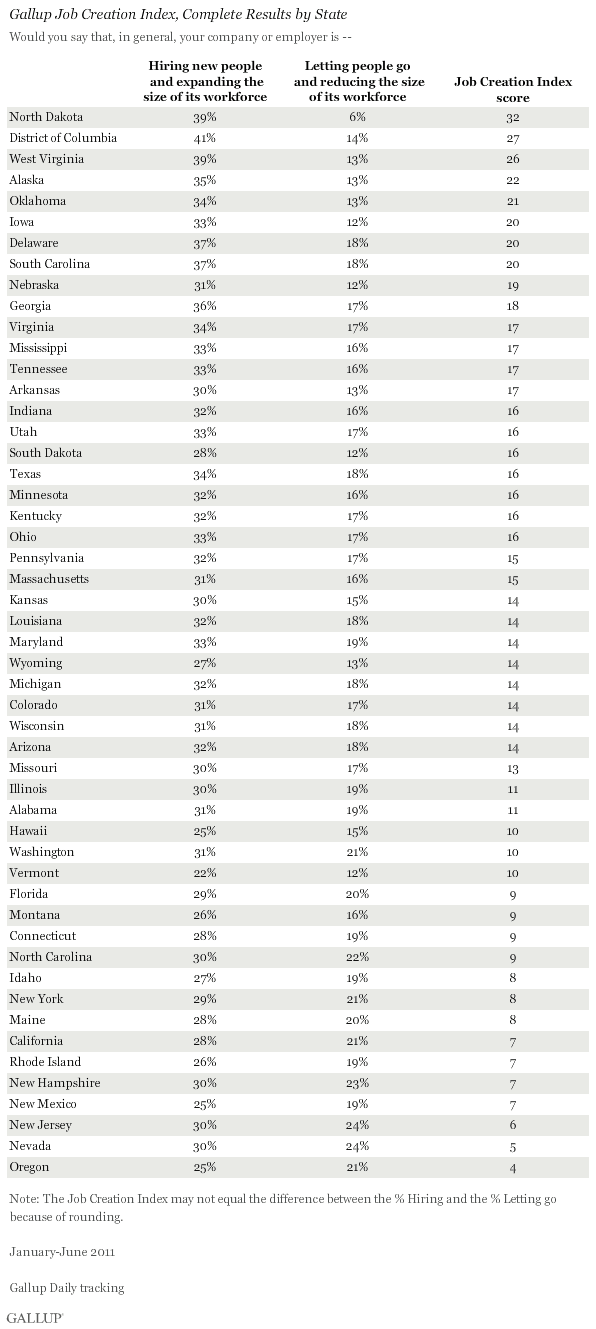
Job market conditions improved during the first half of 2011, with Gallup's Job Creation Index at +13 nationwide, compared with +7 for all of 2010. While 8 states that are in the bottom 10 during the first half of 2011 were also in that group during the first half of 2010, the average score of the bottom 10 states has improved markedly. The Western states of Oregon and New Mexico fell into the bottom 10 job markets this year. See complete results for each state on page 2 of this report.

Job Creation and Economic Confidence Only Sometimes Related
Although jobs are important to every state economy, being a top 10 state job market doesn't necessarily translate into being a top 10 state in economic confidence. Four of the top 10 state job markets during the first half of 2011 are also in the top 10 in economic confidence: the District of Columbia, North Dakota, Nebraska, and Iowa. Similarly, 4 states in the bottom 10 job markets are also in the bottom 10 in economic confidence: Nevada, Idaho, Maine, and Rhode Island.
On the other hand, Delaware and West Virginia are in the top 10 job markets but simultaneously in the bottom 10 in economic confidence. None of the bottom 10 job states are in the top 10 in economic confidence.
Job Market Outlook
One key to a high state ranking in job creation in recent years has been for a state's economy to be based on energy and/or farm commodities. The same has been true for many countries around the world as the growing global economy, particularly in Asia, has greatly increased the demand for such energy/commodities. In turn, this suggests that one thing the U.S. could do to stimulate job growth going forward would be to place more emphasis on expanding the nation's energy and commodity sectors.
However, some signs in the current data suggest this may no longer be the case, at least on an across-the-board basis. The fallout from the Gulf oil spill and the increase in environmental regulations may lessen, rather than increase, the nation's ability to leverage its enormous natural resources. The combination of these factors may partly explain why Texas and Louisiana dropped out of the top 10 job creation states during the first half of 2011.
Further, the global economy is slowing, not only in the U.S. but also in Europe and Asia. Although the price of energy and other commodities is no longer necessarily a result of supply and demand alone -- but instead is acting as a store of value similar to gold and other precious metals for investors -- a decline in global demand is likely to reduce job growth in the energy- and commodity-producing states.
At the same time, new financial industry regulations as well as financial problems in Europe suggest little job growth in the financial sector. The housing sector has a long way to go before returning to growth, given the overhang of foreclosures. Even the federal government may not grow jobs as it has in the past, as efforts are made to cut federal spending.
Overall, Gallup's Job Creation Index results suggest that job market conditions improved during the first half of 2011 compared with a year ago, but not enough to create significant job growth. Whether even this anemic job performance on the part of the U.S. economy will continue during the remainder of 2011 seems far from certain. Similarly uncertain is the ability of a select number of states to continue strongly outperforming the national average, particularly in a slowing global economy.
This story is part of a series of midyear updates on Gallup's State of the States data, to be released in August on Gallup.com. Gallup.com will report new full-year totals in early 2012 based on all 2011 surveys.
Survey Methods
Results are based on telephone interviews with 98,755 employed adults, aged 18 and older, conducted January through June 2011 as part of Gallup Poll Daily tracking. For results based on the total sample of national adults, one can say with 95% confidence that the maximum margin of sampling error is ±1 percentage point.
The margins of sampling error range from ±1 percentage point for large states such as California to ±8 percentage points for the District of Columbia.
Interviews are conducted with respondents on landline telephones and cellular phones, with interviews conducted in Spanish for respondents who are primarily Spanish-speaking. Each sample includes a minimum quota of 400 cell phone respondents and 600 landline respondents per 1,000 national adults, with additional minimum quotas among landline respondents by region. Landline telephone numbers are chosen at random among listed telephone numbers. Cell phone numbers are selected using random-digit-dial methods. Landline respondents are chosen at random within each household on the basis of which member had the most recent birthday.
Samples are weighted by gender, age, race, Hispanic ethnicity, education, region, adults in the household, and phone status (cell phone only/landline only/both, cell phone mostly, and having an unlisted landline number). Demographic weighting targets are based on the March 2010 Current Population Survey figures for the aged 18 and older non-institutionalized population living in U.S. telephone households. All reported margins of sampling error include the computed design effects for weighting and sample design.
In addition to sampling error, question wording and practical difficulties in conducting surveys can introduce error or bias into the findings of public opinion polls.
For more details on Gallup's polling methodology, visit www.gallup.com.

