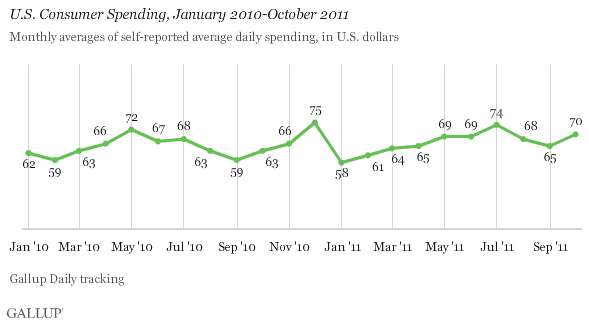
PRINCETON, NJ -- Americans' self-reported discretionary spending averaged $70 per day in October, up slightly from $65 in September but on par with their average level of reported spending throughout the third quarter. Average daily spending last month was slightly higher than the $63 recorded in October 2010.

Gallup measures consumer spending by daily asking U.S. adults aged 18 and older to say how much money they spent or charged the previous day on purchases at a store, restaurant, gas station, online, or elsewhere. Respondents are asked to exclude spending on real estate, motor vehicles, and their normal monthly bills. The latest monthly average of this daily spending measure is based on interviews conducted Oct. 1-30 with 14,887 national adults.
Spending Trend Differs by Income
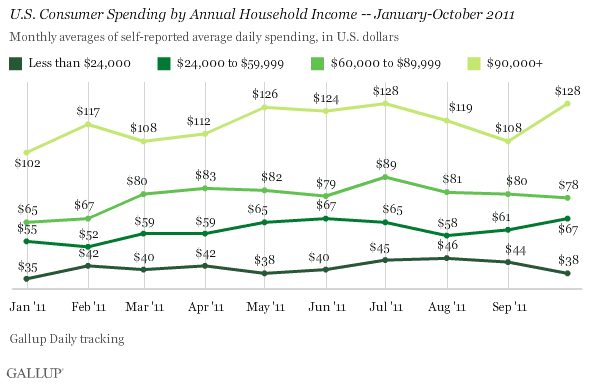
Despite October gas prices that were down from September, spending was largely unchanged among consumers in lower- to middle-income households. The $78 average spending level in October among those in households earning $60,000 to $89,999, the $67 average in households earning between $24,000 and $59,999, and the $38 average in households making less than $24,000 are all statistically unchanged from September. This may reflect the reality that Americans in these income categories generally have little discretionary money -- largely spending all that they have from paycheck to paycheck, regardless of gas prices.
At the same time, Gallup shows average daily spending in October among affluent Americans -- those earning $90,000 or more -- increasing to $128, tying the high for the year from July. Affluent Americans' reported spending had declined slightly in August and September.

Dow's Gyrations May Be Influencing Affluent Spending
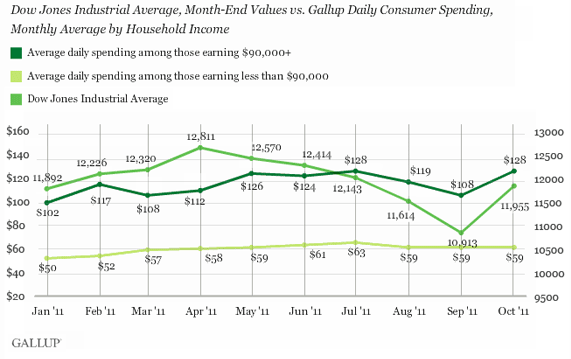
A link between upper-income Americans' recent spending patterns and the stock market is apparent in the accompanying chart, which aligns monthly averages for Gallup's consumer spending metric and end-of-month values for the Dow Jones Industrial Average.
Upper-income Americans' average daily spending increased by $20 in October as the Dow Jones Industrial Average logged a 1,042-point increase from the beginning to the end of the month. A similar pattern is evident through much of 2011.
Upper-income Americans' average daily spending was $9 lower in August compared with July; during August, the Dow fell 530 points. Upper-income spending dropped $11 in September as the Dow fell by 700 points. Affluent Americans' spending also may have reacted to the sharp rise in the Dow in February, but it did not show a similar response to the Dow's increase in April.
Over the same period, spending by lower- and middle-income consumers was relatively flat, with no significant monthly changes in response to monthly changes in the Dow.

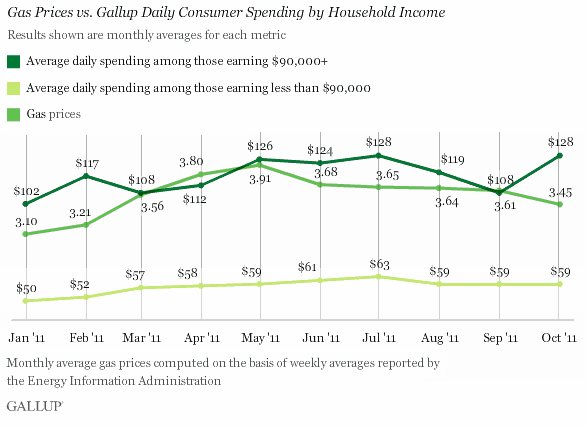
The impact of gas prices on consumer spending is unclear. Gas prices fell by an average of 16 cents between September and October at the same time that average daily spending rose by $20 among upper-income Americans and was essentially unchanged among middle- and lower-income Americans. The last time gas prices fell this steeply between two months was in June, and at that time, there were no changes in spending at any income level.

Bottom Line
The Commerce Department reported on Thursday that the economy, as measured by real GDP, grew at an annual rate of 2.5% in the third quarter, after a more meager 1.3% increase in the second quarter. This welcome advance was partly the result of a 2.4% rise in personal consumption expenditures in the third quarter after a 0.7% rise in the second.
Gallup's consumer spending measure does not include spending on autos -- a sector that the Commerce Department says accounts for some of the third-quarter increase in personal consumption. According to Gallup data, average self-reported spending on routine purchases in these months was up only slightly over the second quarter, from $68 to $69. However, if the trend indicated by October's $70 monthly average spending continues, the fourth quarter could be better.
At least one economist has cautioned that recent consumer spending appears to be based on credit, and therefore may be difficult for consumers to sustain. Additionally, there may be a direct link between the performance of the stock market and affluent Americans' willingness to spend. If the Dow does give back many of the gains it has made in recent weeks, as it has started to, that could affect upper-income spending during the critical holiday retail season. How much additional modest declines in gas prices will help to spur spending is unclear.
Gallup.com reports results from these indexes in daily, weekly, and monthly averages and in Gallup.com stories. Complete trend data are always available to view and export in the following charts:
Daily: Employment, Economic Confidence and Job Creation, Consumer Spending
Weekly: Employment, Economic Confidence, Job Creation, Consumer Spending
Read more about Gallup's economic measures.
View our economic release schedule.
Survey Methods
Results are based on telephone interviews conducted as part of Gallup Daily tracking Oct. 1-30, 2011, with a random sample of 14,887 adults, aged 18 and older, living in all 50 U.S. states and the District of Columbia.
For results based on the total sample of national adults, one can say with 95% confidence that the maximum margin of sampling error is ±1 percentage point.
For results based on the total sample of 2,542 adults in households earning $90,000 or more, one can say with 95% confidence that the maximum margin of sampling error is ±3 percentage points.
For results based on the total sample of 10,015 adults in households earning less than $90,000, one can say with 95% confidence that the maximum margin of sampling error is ±1 percentage point.
Interviews are conducted with respondents on landline telephones and cellular phones, with interviews conducted in Spanish for respondents who are primarily Spanish-speaking. Each sample includes a minimum quota of 400 cell phone respondents and 600 landline respondents per 1,000 national adults, with additional minimum quotas among landline respondents by region. Landline telephone numbers are chosen at random among listed telephone numbers. Cell phone numbers are selected using random-digit-dial methods. Landline respondents are chosen at random within each household on the basis of which member had the most recent birthday.
Samples are weighted by gender, age, race, Hispanic ethnicity, education, region, adults in the household, and phone status (cell phone only/landline only/both, cell phone mostly, and having an unlisted landline number). Demographic weighting targets are based on the March 2010 Current Population Survey figures for the aged 18 and older non-institutionalized population living in U.S. telephone households. All reported margins of sampling error include the computed design effects for weighting and sample design.
The questions reported here were asked of a random half-sample of respondents for 30 nights on the Gallup Daily tracking survey.
In addition to sampling error, question wording and practical difficulties in conducting surveys can introduce error or bias into the findings of public opinion polls.
For more details on Gallup's polling methodology, visit www.gallup.com.
