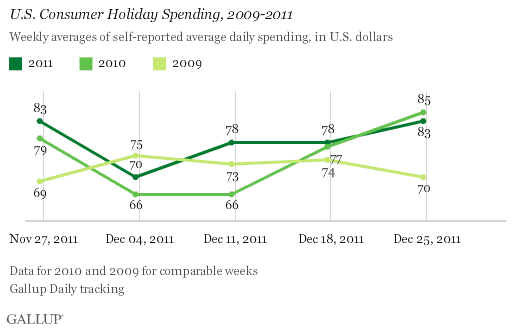
PRINCETON, NJ -- Self-reported daily consumer spending in stores, restaurants, gas stations, and online averaged $83 per day in the week ending Dec. 25 -- not much different than the $85 of a year ago. After getting off to a good start during the first three weeks of the holiday season, consumer spending decreased to match 2010 levels in the past two weeks.

Even so, consumer spending averaged $78 over the five-week holiday period of Nov. 21 to Dec. 25. This is up 4.1% from the comparable five-week period of 2010 and essentially the same as the 4.2% increase Gallup registered over the same period in 2009.
The increase in spending during this year's holiday season was also evident in Gallup's Christmas spending intentions question, which asks Americans to estimate how much they plan to spend on Christmas gifts. Gallup found Americans estimated they would spend more on Christmas gifts in November and December of this year than they did in the same months last year.
Implications
The 4.1% increase in self-reported consumer spending that Gallup found this holiday shopping season is consistent with the National Retail Federation's holiday sales expectation of a 3.8% increase. The most positive Economic Confidence Index reading since mid-July, some of the lowest unemployment numbers of the year, the lowest jobless claims since 2008, and the lowest gas prices since February all helped to create a more favorable environment for holiday sales in 2011.
While the spending increases this year may seem disappointing to some given all these positive economic trends, there are some significant countervailing factors. Economic confidence remains worse than during each of the previous two holiday seasons, unemployment and underemployment are still high, gas prices are higher than they were a year ago, and Americans' evaluations of the way the U.S. government is functioning are at record-low levels. Further, the financial crisis in Europe continues to raise havoc with Wall Street and American companies' international operations.
Given this fuller context, many retailers are probably happy with an increase in overall consumer spending this Christmas holiday. However, it may have come at a price to their bottom line. Retailers have had to be aggressive this year using heavy promotions and price discounting throughout the holidays. As a result, retailer margins may not be as good as hoped for when earnings are reported early next year.
Regardless, this year's improved holiday sales are consistent with what seems to be a modest improvement in the overall U.S. economy as 2011 ends. Whether this slightly positive forward momentum can be maintained in early 2012 is yet to be seen.
Gallup.com reports results from these indexes in daily, weekly, and monthly averages and in Gallup.com stories. Complete trend data are always available to view and export in the following charts:
Daily: Employment, Economic Confidence and Job Creation, Consumer Spending
Weekly: Employment, Economic Confidence, Job Creation, Consumer Spending
Read more about Gallup's economic measures.
View our economic release schedule.
Survey Methods
Results are based on telephone interviews conducted as part of the Gallup Daily tracking survey during the period of Monday to Sunday with random weekly samples averaging more than 3,000 adults, aged 18 and older, living in all 50 U.S. states and the District of Columbia, selected using random-digit-dial sampling.
For results based on weekly samples averaging 3,000 or more national adults, one can say with 95% confidence that the maximum margin of sampling error is ±3 percentage points.
Interviews are conducted with respondents on landline telephones and cellular phones, with interviews conducted in Spanish for respondents who are primarily Spanish-speaking. Each sample includes a minimum quota of 400 cell phone respondents and 600 landline respondents per 1,000 national adults, with additional minimum quotas among landline respondents by region. Landline telephone numbers are chosen at random among listed telephone numbers. Cell phone numbers are selected using random-digit-dial methods. Landline respondents are chosen at random within each household on the basis of which member had the most recent birthday.
Samples are weighted by gender, age, race, Hispanic ethnicity, education, region, adults in the household, and phone status (cell phone only/landline only/both, cell phone mostly, and having an unlisted landline number). Demographic weighting targets are based on the March 2010 Current Population Survey figures for the aged 18 and older non-institutionalized population living in U.S. telephone households. All reported margins of sampling error include the computed design effects for weighting and sample design.
In addition to sampling error, question wording and practical difficulties in conducting surveys can introduce error or bias into the findings of public opinion polls.
For more details on Gallup's polling methodology, visit www.gallup.com.
