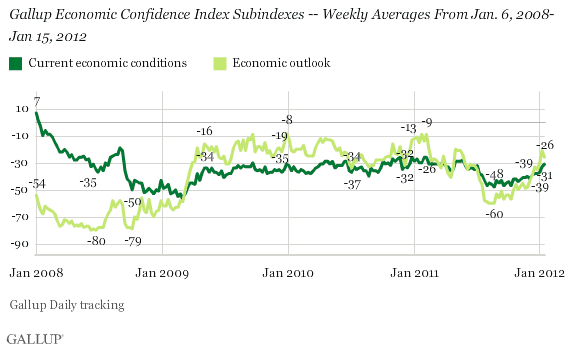
PRINCETON, NJ -- The Gallup U.S. Economic Confidence Index remains near its seven-month high at -29 in the week ending Jan. 15, similar to -27 the prior week. However, economic confidence continues to trail the -19 of a year ago.

The Gallup Economic Confidence Index is an average of two components: Americans' ratings of current economic conditions and their outlook for the economy. Americans have steadily grown more positive about current economic conditions in the past two weeks. At the same time, they were less positive about the future direction of the economy in the latest week than the week prior.

Both dimensions have improved since July 2011. However, there has been relatively more improvement along the Economic Outlook dimension. For example, the 34% of Americans saying the economy is "getting better" in the latest week and the 37% of the prior week are the highest since May. However, this is not yet as high as the 42% of Americans who held this position in the same week a year ago, before the federal budget ceiling crisis.

Bottom Line
Last week's leveling off in economic confidence might reflect a post-holiday stabilization. More likely, recent increases in gas prices, increases in jobless claims, and Wall Street's continuing concerns about the financial crisis in Europe may be offsetting the modest improvement in the U.S. unemployment situation in Americans' minds.
While improving economic confidence would be a positive for President Barack Obama's re-election chances, it is worth noting that Americans are less optimistic now than they were at this time a year ago. Further improvements in the unemployment situation and the U.S. economy as a whole could go a long way toward returning economic confidence to early 2011 levels and higher.
However, it is also worth noting that economic confidence plunged in August 2011 as Congress and the president faced off over the debt ceiling. In this presidential election year, politicians should recognize that political battles could have real-world consequences for the U.S. economy.
Gallup.com reports results from these indexes in daily, weekly, and monthly averages and in Gallup.com stories. Complete trend data are always available to view and export in the following charts:
Daily: Employment, Economic Confidence and Job Creation, Consumer Spending
Weekly: Employment, Economic Confidence, Job Creation, Consumer Spending
Read more about Gallup's economic measures.
View our economic release schedule.
Survey Methods
Results are based on telephone interviews conducted weekly as part of the Gallup Daily tracking with a random sample of more than 2,000 adults, aged 18 and older, living in all 50 U.S. states and the District of Columbia, selected using random-digit-dial sampling.
For results based on the total sample of national adults, one can say with 95% confidence that the maximum margin of sampling error is ±3 percentage points.
Results for the week ending Jan. 15, 2012, are based on 3,558 telephone interviews conducted as part of the Gallup Daily tracking with adults, aged 18 and older, living in all 50 U.S. states and the District of Columbia, selected using random-digit-dial sampling.
For results based on this weekly sample of national adults, one can say with 95% confidence that the maximum margin of sampling error is ±3 percentage points.
Interviews are conducted with respondents on landline telephones and cellular phones, with interviews conducted in Spanish for respondents who are primarily Spanish-speaking. Each sample includes a minimum quota of 400 cell phone respondents and 600 landline respondents per 1,000 national adults, with additional minimum quotas among landline respondents by region. Landline telephone numbers are chosen at random among listed telephone numbers. Cell phone numbers are selected using random-digit-dial methods. Landline respondents are chosen at random within each household on the basis of which member had the most recent birthday.
Samples are weighted by gender, age, race, Hispanic ethnicity, education, region, adults in the household, and phone status (cell phone only/landline only/both, cell phone mostly, and having an unlisted landline number). Demographic weighting targets are based on the March 2011 Current Population Survey figures for the aged 18 and older non-institutionalized population living in U.S. telephone households. All reported margins of sampling error include the computed design effects for weighting and sample design.
In addition to sampling error, question wording and practical difficulties in conducting surveys can introduce error or bias into the findings of public opinion polls.
For more details on Gallup's polling methodology, visit www.gallup.com.
