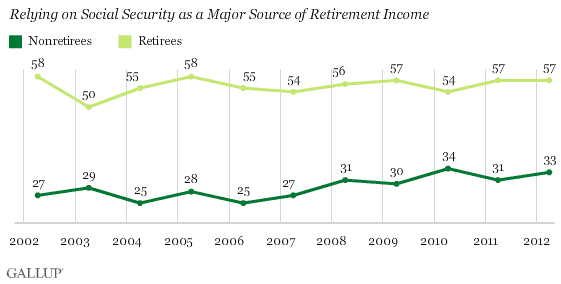
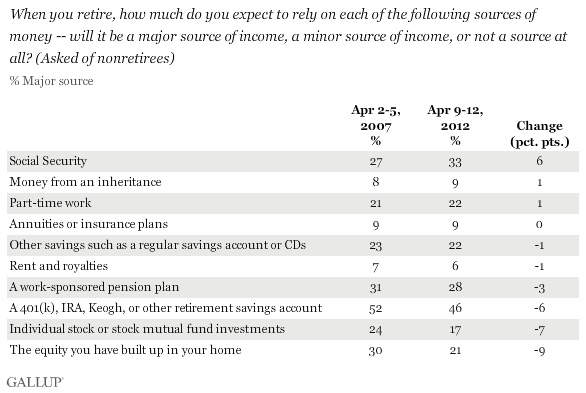
PRINCETON, NJ -- Thirty-three percent of American nonretirees now anticipate that Social Security will be a major retirement funding source. In 2007, prior to the recession and financial crisis, just 27% did so.

Even after this increase, nonretirees are much less likely to see Social Security as a major retirement funding source (33%) than current retirees are to say they rely on it as a major source of income today (57%). This gap in nonretiree expectations versus retiree reality has been a consistent trend over the past decade.
Nonretirees' Expectations About Income Sources Differ From Current Retirees' Sources
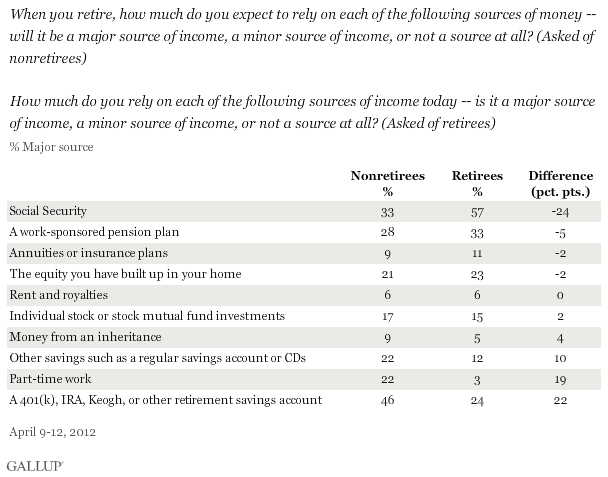
In addition to Social Security, 33% of current retirees say pension plans are a major source of their retirement income. Other sources in this group's top five include retirement accounts such as 401(k)s at 24%, home equity at 23%, and individual stocks and mutual funds at 15%.
In contrast, 46% of nonretirees expect their retirement accounts to be a major source of retirement funding, followed by Social Security (33%), pension plans (28%), savings accounts or CDs (22%), and part-time work (22%).

Current retirees are more likely than nonretirees to name Social Security as a major source of retirement income, while nonretirees are more likely to name retirement accounts (46% for nonretirees vs. 24% for retirees), part-time work (22% vs. 3%), and savings accounts (22% vs. 12%).
These differences between the retirement income sources of current retirees and the expected retirement income sources of nonretirees have been largely unchanged in recent years.
However, nonretirees' expectations have changed since 2007. Fewer nonretirees expect to use their home equity (down nine percentage points), individual stocks and mutual funds (down seven points), and retirement accounts (down six points) as a source of retirement income, while more expect to use Social Security (up six points).

Implications
The financial crisis of 2008-2009 and the slow economy that followed appear to have had an impact on Americans' retirement expectations. Americans now expect to retire at an average age of 67, up from 60 in the 1990s. Further, a new low of 38% of nonretirees expect to retire comfortably.
In large part, this is likely related to nonretirees' expectations for their retirement income sources. The sharp drop in home values has reduced expectations that they can use home equity to fund their retirement. Similarly, stock and retirement-account losses have made future retirees less likely to view these as major retirement funding sources.
While older nonretirees have little time to rebuild their lost wealth, whether it involves real estate or other investments, they can delay retiring. Amazingly, more than one in five older nonretirees expect part-time work to be a major source of their retirement income. Further, more nonretired Americans today expect Social Security to be a major source of their retirement income than did so a few years ago. All of this seems to clearly indicate why many nonretirees do not expect to retire comfortably.
Poll results showing many Americans planning to retire later and less comfortably have important implications for the workforce participation rate -- an important job-related issue of debate. The question is whether the percentage of Americans in the workforce -- those working or looking for work -- is declining because of the economic downturn or, instead, because of the large number of baby boomers reaching retirement age.
It seems likely that the workforce participation rate will remain high if many Americans, particularly baby boomers, continue to work past traditional retirement age, potentially increasing the overall unemployment rate as the economy improves. This is just the reverse of the idea that the workforce participation rate will continue to decline, and the unemployment rate along with it, as baby boomers reach traditional retirement age.
Survey Methods
Results for this Gallup poll are based on telephone interviews conducted April 9-12, 2012, with a random sample of 1,016 adults, aged 18 and older, living in all 50 U.S. states and the District of Columbia.
For results based on the total sample of national adults, one can say with 95% confidence that the maximum margin of sampling error is ±4 percentage points.
For results based on the sample of 672 nonretirees, the maximum margin of sampling error is ±5 percentage points.
For results based on the sample of 344 retirees, the maximum margin of sampling error is ±7 percentage points.
Interviews are conducted with respondents on landline telephones and cellular phones, with interviews conducted in Spanish for respondents who are primarily Spanish-speaking. Each sample includes a minimum quota of 400 cell phone respondents and 600 landline respondents per 1,000 national adults, with additional minimum quotas among landline respondents by region. Landline telephone numbers are chosen at random among listed telephone numbers. Cell phone numbers are selected using random-digit-dial methods. Landline respondents are chosen at random within each household on the basis of which member had the most recent birthday.
Samples are weighted by gender, age, race, Hispanic ethnicity, education, region, adults in the household, and phone status (cell phone only/landline only/both, cell phone mostly, and having an unlisted landline number). Demographic weighting targets are based on the March 2011 Current Population Survey figures for the aged 18 and older non-institutionalized population living in U.S. telephone households. All reported margins of sampling error include the computed design effects for weighting and sample design.
In addition to sampling error, question wording and practical difficulties in conducting surveys can introduce error or bias into the findings of public opinion polls.
View methodology, full question results, and trend data.
For more details on Gallup's polling methodology, visit www.gallup.com.
