PRINCETON, NJ -- The average nonretired American now expects to retire at age 67, up from age 63 a decade ago and age 60 in the mid-1990s.

The results are from Gallup's annual Economy and Personal Finance survey, conducted April 9-12. Overall, 26% of nonretirees expect to retire before age 65, with 27% expecting to retire at age 65 and 39% after age 65. The percentage that expect to retire after age 65 is up from 21% in 2002 and 12% in 1995.
Gallup also finds a steady, although less steep, increase in the average age at which retirees actually retired, from age 57 in 1991 to age 60 today. The average retirement age first reached 60 in 2004 and has generally held there since. That average should increase in future years if current nonretirees delay their retirement, as they expect to do.
Today's younger nonretirees are more optimistic about being able to retire at an earlier age than those closer to retirement. Those currently under age 40 expect to retire at age 65, compared with an expected retirement age of 68 for those aged 40 and older, a statistically significant difference.
Fewer Expect Comfortable Retirement
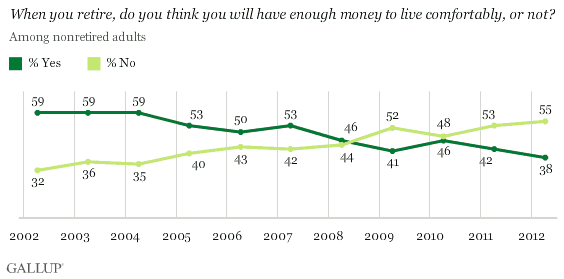
The same poll finds a new low of 38% of nonretirees saying they will have enough money to live comfortably in retirement, down slightly from 42% last year. When Gallup first asked the question in 2002, 59% thought they would have enough. The percentage dipped below 50% during the recession and has remained below since.

The decline in expected financial comfort in retirement mirrors the decline in the percentage of all Americans who say they have enough money to live comfortably now.
The 38% of nonretirees who expect to live comfortably in retirement stands in sharp contrast to the 72% of current retirees who say they have enough to live comfortably. It is also significantly lower than the 57% of nonretirees who say they have enough to live comfortably now.
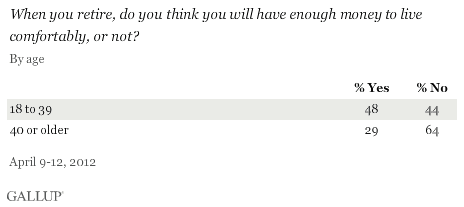
Younger nonretirees are also more optimistic than those closer to retirement age about their post-retirement financial situation. Slightly more nonretirees under age 40 believe they will have enough money to live comfortably in retirement (48%) than believe they will not (44%). By comparison, nonretirees aged 40 and older are more than twice as likely to think they will not have a comfortable retirement (64%) than to think they will (29%).

Implications
Americans' expectations for retirement have changed in recent years, with more presuming they will have to work to an older age and fewer expecting to enjoy a financially secure retirement, particularly those nearer retirement age.
Those changes are understandable given recent shocks to the economy such as the recession, the financial crisis, the housing bust, and stock market volatility. Once the economy begins to move in a more strongly positive direction, Americans may regain some optimism about their retirement. However, the early 2000s stock market crash and late 2000s housing crash may have caused Americans to more soberly evaluate the expected gains they can get from common investments to fund retirement.
In addition to national economic problems, there remain serious questions about the long-term health of Social Security and Medicare, two programs that have helped U.S. retirees for at least five decades. Proposals to shore up Medicare and Social Security often involve increasing the age at which Americans are eligible for benefits, which could push U.S. workers' expected retirement age even higher in the future.
Thus, the recent changes in Americans' expectations about their retirement may indicate a more permanent change in their outlook rather than a temporary downtick.
Survey Methods
Results for this Gallup poll are based on telephone interviews conducted April 9-12, 2012, with a random sample of 1,016 adults, aged 18 and older, living in all 50 U.S. states and the District of Columbia.
For results based on the total sample of national adults, one can say with 95% confidence that the maximum margin of sampling error is ±4 percentage points.
For results based on the sample of 672 nonretirees, the maximum margin of sampling error is ±5 percentage points.
For results based on the sample of 344 retirees, the maximum margin of sampling error is ±7 percentage points.
Interviews are conducted with respondents on landline telephones and cellular phones, with interviews conducted in Spanish for respondents who are primarily Spanish-speaking. Each sample includes a minimum quota of 400 cell phone respondents and 600 landline respondents per 1,000 national adults, with additional minimum quotas among landline respondents by region. Landline telephone numbers are chosen at random among listed telephone numbers. Cell phone numbers are selected using random-digit-dial methods. Landline respondents are chosen at random within each household on the basis of which member had the most recent birthday.
Samples are weighted by gender, age, race, Hispanic ethnicity, education, region, adults in the household, and phone status (cell phone only/landline only/both, cell phone mostly, and having an unlisted landline number). Demographic weighting targets are based on the March 2011 Current Population Survey figures for the aged 18 and older non-institutionalized population living in U.S. telephone households. All reported margins of sampling error include the computed design effects for weighting and sample design.
In addition to sampling error, question wording and practical difficulties in conducting surveys can introduce error or bias into the findings of public opinion polls.
View methodology, full question results, and trend data.
For more details on Gallup's polling methodology, visit https://www.gallup.com/.
