PRINCETON, NJ -- Gallup Daily tracking indicates Barack Obama is receiving less support in the 2012 presidential election from some of the white subgroups that gave him the strongest support in 2008. These include non-Hispanic white registered voters who are 18 to 29 years old, female postgrads, and the nonreligious, among others.
Obama won the 2008 election comfortably over John McCain, but the 2012 election contest with Mitt Romney is shaping up to be more competitive, with the two statistically tied since Gallup started Daily tracking on the race in April. These findings partly explain why.
For this analysis, Gallup has compared Obama's current support among registered voters, based on Gallup Daily tracking from May 21-June 10 with 7,343 registered voters, to his support among registered voters in Gallup's last month of interviewing in the 2008 pre-election poll, from Oct. 1-Nov. 2, comprising 30,623 registered voters.
Obama Down Five Percentage Points Among All Voters
The 46% of registered voters supporting Obama today is five percentage points below the 51% supporting him in final weeks of the 2008 election campaign. Similarly, whites' support for Obama is six points lower than it was in October/November 2008 (38% vs. 44%), and blacks' is down four points (87% vs. 91%). At the same time, Hispanics' support, at 67%, is essentially unchanged.
Whites make up about three-quarters of all U.S. registered voters, and are therefore the most important racial or ethnic group in any election, at least mathematically. Even if Obama were to regain his 2008 level of support among blacks and improve his support somewhat among Hispanics, he could still lose if his support among whites slips any further. By the same token, even a slight increase in whites' support could secure his re-election.

The following sections look at key U.S. registered voter groups: age, gender/educational status, gender/marital status, and religiosity. Because the political views of U.S. blacks, Hispanics, and other racial or ethnic minorities are largely monolithic, the analysis of these demographic trends is based solely on non-Hispanic whites.
Young Voters Remain Most Supportive, but to a Lesser Degree
Whites' support for Obama in 2008 differed significantly by age, with young voters the most supportive and seniors the least supportive. That basic pattern continues today, although Obama's support has dropped more among young voters than among seniors, thus narrowing the overall generation gap.
Currently, 43% of white 18- to 29-year-olds say they plan to vote for Obama in the election, down nine points from the 52% backing him in 2008. By contrast, Obama has lost five points among whites aged 30 to 49 and six points each among the two older age groups.
Obama Support Slips Among White Postgrads of Both Genders
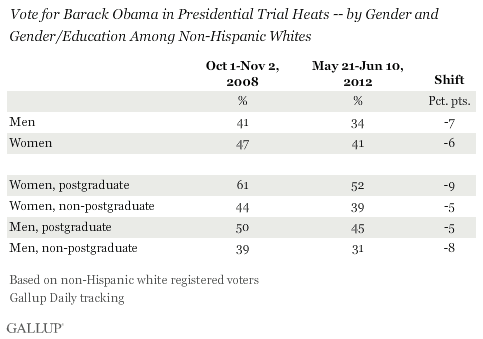
Obama still enjoys higher support from white women than white men, as he did in 2008; however, his support from both groups has declined. Now, 34% of white men and 41% of white women support him, while the plurality or majority of both groups support Romney.
Beyond the overall gender breaks, support for Obama was particularly high among white men and women with postgraduate levels of education in 2008, and remains so today. But support for Obama in 2012 is down among all four gender/education groups, and is down the most -- by nine points -- among postgraduate women, followed by non-postgraduate men (eight points).
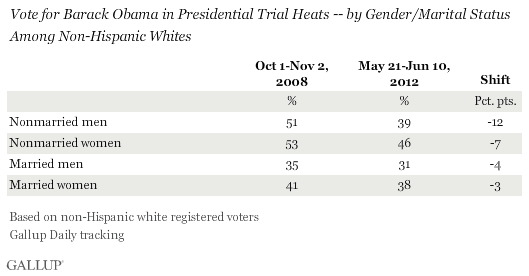
Nonmarried white men and women were more supportive of Obama in the 2008 election than their married counterparts, and that also holds today. However, support for Obama among the nonmarried has declined more sharply than that of white married voters, with the decline particularly sharp among nonmarried men.
Obama Loses Support Among Low-Income Whites
There was a modest income skew in Obama's support among whites in 2008, but that has largely disappeared in the recent 2012 data, given the larger-than-average declines in support seen for him among low-income whites.
Obama's support is down nine points among those earning less than $24,000 as well as among those earning $24,000 to $59,999 per year. At the same time, his support among higher-income Americans is down only three points.
Nonreligious and Non-Christian Support for Obama Down
Religious identity and religiosity continue to be significant predictors of support for Obama, with nonreligious Americans (61%) and adherents of non-Christian faiths (60%) being the most supportive. These are followed by non-active Catholics (that is, those who seldom or never attend church), then non-active Protestants, and then active/churchgoing Catholics. Active/churchgoing Protestants (24%) are by far the least supportive of Obama.
Although support for Obama is down at least slightly among all major religious groupings since 2008, the greatest declines are seen among the two strongest groups of Obama supporters -- the nonreligious and those identifying with a non-Christian religion. The latter finding is consistent with a Gallup report published last week showing Obama's electoral support among Jewish voters down by 10 points over the same period.
Bottom Line
U.S. voters are roughly tied in their preferences for Obama vs. Romney for president, in contrast to Obama's nine-point lead over McCain among registered voters in October/November 2008. This is reflected in declines in support for Obama among most voter subgroups, and particularly among white subgroups. Although these declines are generally not dramatic, they are enough to make the 2012 race at this point more competitive than the 2008 election.
Obama's support is down about equally among whites and blacks, while it is unchanged among Hispanics. Additionally, Obama has generally lost more support from the white subgroups that were most supportive of him in 2008 -- young adults, postgraduate women, nonmarried women, residents of low-income households, non-Christians, and nonreligious adults -- than from the white subgroups that were less supportive. Obama has also lost a greater-than-average amount of support among nonmarried men and non-postgraduate men.
The declines in support among Obama's core white supporters may be especially troubling for him if his campaign strategy is, as many have speculated, to repeat his strong 2008 performance among women, the working class, and young voters, as well as minorities. On the one hand, these findings suggest his campaign may need to do more to mobilize those voters. On the other hand, the decline among his core 2008 white supporters could make these the easiest groups of voters for him to win back -- something the Democratic Convention this summer and Obama's fall campaigning will no doubt strive to do.
Track every angle of the presidential race on Gallup.com's Election 2012 page.
Survey Methods
The 2012 results are based on telephone interviews conducted as part of Gallup Daily tracking May 21-June 10, 2012, with a random sample of 7,343 registered voters, aged 18 and older, living in all 50 U.S. states and the District of Columbia. For results based on the total sample of registered voters, one can say with 95% confidence that the maximum margin of sampling error is ±1 percentage points.
The 2012 results are based on telephone interviews conducted as part of Gallup Daily tracking Oct. 1-Nov. 2, 2008, with a random sample of 30,623 registered voters, aged 18 and older, living in all 50 U.S. states and the District of Columbia. For results based on the total sample of registered voters, one can say with 95% confidence that the maximum margin of sampling error is ±1 percentage points.
Interviews are conducted with respondents on landline telephones and cellular phones, with interviews conducted in Spanish for respondents who are primarily Spanish-speaking. Each sample includes a minimum quota of 400 cell phone respondents and 600 landline respondents per 1,000 national adults, with additional minimum quotas among landline respondents by region. Landline telephone numbers are chosen at random among listed telephone numbers. Cell phone numbers are selected using random-digit-dial methods. Landline respondents are chosen at random within each household on the basis of which member had the most recent birthday.
Samples are weighted by gender, age, race, Hispanic ethnicity, education, region, adults in the household, and phone status (cell phone only/landline only/both, cell phone mostly, and having an unlisted landline number). Demographic weighting targets are based on the March 2011 Current Population Survey figures for the aged 18 and older non-institutionalized population living in U.S. telephone households. All reported margins of sampling error include the computed design effects for weighting and sample design.
The 2012 questions reported here were asked of a random half-sample of respondents for 21 nights on the Gallup Daily tracking survey.
In addition to sampling error, question wording and practical difficulties in conducting surveys can introduce error or bias into the findings of public opinion polls.
For more details on Gallup's polling methodology, visit www.gallup.com.
